Alternative Streaming Quotes for European Equities
Alternative Streaming Quotes for EU Equities
On August 1st, 2022, clients with non-professional or non-commercial market data subscriber status will receive complimentary real-time streaming Best Bid and Offer and last sale quotes on European Equities. These quotes will be aggregated from exchanges such as Cboe Europe, Gettex, Tradegate and Turquoise. The data will display in the SMART quote line and can be used to generate a chart as well.
Eligible users will see a no charge service called 'Alternative European Equities (L1)' added to their account on or before August 1, 2022. Please note this will be a default Market Data service that cannot be removed.
Users who would like to receive the full EBBO (European Best Bid and Offer) will need to subscribe to the individual exchange subscriptions.
Considérations d'abonnement aux données de marché américaines (pour non-professionnels)
En déterminant la gamme d’offres d’abonnement aux données de marché à mettre à disposition, IBKR cherche à équilibrer les besoins d’une grande variété de clients, à la fois en termes de gamme de produits tradés et de fréquence d’utilisation des données. Pour offrir aux clients la possibilité de minimiser leurs coûts d’abonnement mensuel pour les données américaines, des services mensuels groupés et à la carte sont proposés ainsi que des options de diffusion en temps réel, aperçu et les flux en différé. Veuillez noter que, conformément aux exigences réglementaires, IBKR ne propose plus d’informations de cotation différée sur les actions américaines aux clients d’Interactive Brokers LLC.
Quels produits US tradez-vous ?
À quelle fréquence souhaitez-vous recevoir les cotations en temps réel ?
Quel montant de commissions générer vous généralement par mois ?
Sur quelles bourses tradez-vous ?
- Liasse US Equity and Options Add-On Streaming1 : Comprend NYSE (Network A), AMEX (Network B), NASDAQ(Network C), et OPRA (Options américaines). Pensé pour les utilisateurs qui tradent fréquemment des titres cotés uniquement sur toutes les bourses ci-dessus. Remplacera les cotations instantanées fournies dans un abonnement simple à la liasse Aperçu de titres U.S et valeur de contrats à terme.
Données de marché de produits de cryptomonnaie
Actions/ETF
États-Unis
GBTC @ PINK
- Non-professionnels
- Level 1 : OTC Markets (NP,L1)
- Level 1 : Liasse Value Aperçu titres et contrat à terme U.S (NP,L1)
- Level 2 : OTC Markets (NP,L2)
- Level 2 : Global OTC and OTC Markets (NP,L2)
- Professionnels
- Level 1 : OTC Markets (P,L1)
- Level 1 : Professional US Securities Snapshot Bundle (P,L1)
- Level 2 : OTC Markets (P,L2)
- Level 2 : Global OTC and OTC Markets (P,L2)
Hors États-Unis
BITCOINXB @ SFB
- Non-professionnels
- Level 1 : Nordic Equity (NP,L1)
- Level 2 : Nordic Equity (NP,L2)
- Professionnels
- Level 1 : Nordic Equity (P,L1)
- Level 2 : Nordic Equity (P,L2)
COINETH @ SFB
- Non-professionnels
- Level 1 : Nordic Equity (NP,L1)
- Level 2 : Nordic Equity (NP,L2)
- Professionnels
- Level 1 : Nordic Equity (P,L1)
- Level 2 : Nordic Equity (P,L2)
COINETHE @ SFB
- Non-professionnels
- Level 1 : Nordic Equity (NP,L1)
- Level 2 : Nordic Equity (NP,L2)
- Professionnels
- Level 1 : Nordic Equity (P,L1)
- Level 2 : Nordic Equity (P,L2)
Indices
BRR/BRTI @ CME
- Non-professionnels
- CME Temps réel Non-Professionnel Level 1
- Liasse Aperçu de titres U.S et valeur de contrats à terme (NP,L1)
- Professionnels
- CME Temps réel Professionnel Level 2 (Il n'y a pas de produits CME Pro level 1)
NYXBT @ FWB/SWB
- Non-professionnels
- FWB: Spot Market Germany (Frankfurt/Xetra)(NP,L1)
- SWB: Stuttgart Boerse incl. Euwax (SWB) (NP,L1)
- Professionnels
- FWB: Spot Market Germany (Frankfurt/Xetra) (P,L1)
- SWB: Stuttgart Boerse incl. Euwax (SWB) (P,L1)
Contrats à terme
BRR @ CME
ETHUSDRR @ CME
- Non-professionnels
- Level 1: CME Temps réel Non-Professionnel Level 1
- Level 1 : Liasse Value Aperçu titres et contrat à terme U.S (NP,L1)
- Level 2 : CME Temps réel Non-Professionnel Level 2
- Level 2 : Liasse US Value PLUS (NP,L2)
- Les liasses Aperçu de titres U.S et Contrats à terme Value sont requises.
- Uniquement pour la profondeur du carnet
- Professionnels
- Level 2 : CME Temps réel Professionnel Level 2 (Il n'y a pas de produits CME Pro level 1)
BAKKT @ ICECRYPTO
- Non-professionnels
- ICE Futures US (NP)
- Professionnels
- ICE Futures US (P)
Retour à la Table des matières : Bitcoin et autres produits de cryptomonnaie chez IBKR
Comment déterminer quel abonnement aux données de marché s'applique pour un titre donné ?
IBKR propose un outil Assistant données de marché qui aide à choisir les services d'abonnement aux données de marché disponibles pour un titre donné (action, option ou warrant) qu'ils souhaitent trader. Les résultats de recherche indiquent toutes les bourses sur lesquelles le produit est tradé, l'abonnement proposé et les frais mensuels pour les clients professionnels et non professionnels, ainsi que les variations de la profondeur de marché associées à chaque abonnement.
Pour accéder à l'Assistant données de marché :
- Connectez-vous au Portail Client
- Cliquez sur le menu Aide (icône point d'interrogation en haut à droite), puis sur Centre d'assistance
- Faites défiler et sélectionnez Assistant données de marché
- Saisissez le symbole ou ISIN et la Bourse
- Choisissez une valeur pour les filtres facultatifs : Statut d'abonné professionnel/non professionnel, devise et actif
- Cliquez sur Rechercher
- Consultez les options disponibles et choisissez l'abonnement qui vous convient le mieux.
Plus d'informations sur la page de choix de données de marché du site d'IBKR.
Données de marché en différé
Les fournisseurs de données de marché proposent en général des données de bourse en deux catégories, en temps réel et en différé. Les données de marché en temps réel est transmise dès que l'information est disponible au public. Les données de marché en différé ont généralement un décalage de 10-20 min après les cotations en temps réel.
Certaines Bourses permettent aux données en différé d'être affichées sans abonnement aux données de marché, gratuitement. Une liste des bourses pour lesquelles nous fournissons des données de marché en différé sans coût et sans demande formelle (c'est-à-dire que les données en différé seront affichées au moment de la saisie du symbole du produit sur la plateforme de trading) est disponible dans le tableau ci-dessous. Le tableau indique aussi l'abonnement en temps réel correspondant. Les frais correspondants sont publiés sur le site d'IBKR.
Remarque :
- Conformément aux exigences réglementaires, IBKR ne propose plus d'informations de cotation en différé sur les titres des États-Unis aux clients d'Interactive Brokers LLC.
- Les cotations en différé doivent être utilisées à titre indicatif et pas nécessairement pour le trading. Les périodes indiquées peuvent faire l'objet de délais ultérieurs sans préavis.
Amérique
| Nom de la Bourse externe | Nom de la Bourse IB | Différé | Abonnement en temps réel |
| CBOT | CBOT | 10 minutes | CBOT Real-Time |
| CBOE Futures Exchange | CFE | 10 minutes | CFE Enhanced |
| Market Data Express (MDX) | CBOE | 10 minutes | CBOE Market Data Express Indices |
| CME | CME | 10 minutes | CME Real-Time |
| COMEX | COMEX | 10 minutes | COMEX Real-Time |
| ICE US | NYBOT | 10 minutes | ICE Futures U.S. (NYBOT) |
| Mexican Derivatives Exchange | MEXDER | 15 minutes | Mexican Derivatives Exchange |
| Mexican Stock Exchange | MEXI | 20 minutes | Mexican Stock Exchange |
| Montreal Exchange | CDE | 15 minutes | Montreal Exchange |
| NYMEX | NYMEX | 10 minutes | NYMEX Real-Time |
| NYSE GIF | NYSE | 15 minutes | NYSE Global Index Feed |
| One Chicago | ONE | 10 minutes | OneChicago |
| OPRA | OPRA | 15 minutes | OPRA Haut du carnet (L1) (US Option Exchanges) |
| Marchés OTC | PINK | 15 minutes | Marchés OTC |
| Toronto Stock Exchange | TSE | 15 minutes | Toronto Stock Exchange |
| Venture Exchange | VENTURE | 15 minutes | TSX Venture Exchange |
Europe
| Nom de la Bourse externe | Nom de la Bourse IB | Différé | Abonnement en temps réel |
| BATS Europe | BATE/CHIX | 15 minutes | European (BATS/Chi-X) Equities |
| Boerse Stuttgart | SWB | 15 minutes | Stuttgart Boerse incl. Euwax (SWB) |
| Bolsa de Madrid | BM | 15 minutes | Bolsa de Madrid |
| Borsa Italiana | BVME/IDEM | 15 minutes | Borsa Italiana (BVME stock / SEDEX / IDEM deriv) |
| Budapest Stock Exchange | BUX | 15 minutes | Budapest Stock Exchange |
| Eurex | EUREX | 15 minutes | Eurex Real-Time Information |
| Euronext | AEB/SBF/MATIF/BELFOX | 15 minutes | Euronext Cash |
| Euronext | AEB/SBF/MATIF/BELFOX | 15 minutes | Euronext Data Bundle |
| Frankfurt Stock Exchange and XETRA | FWB/IBIS/XETRA | 15 minutes | Allemagne Spot Market (Francfort/Xetra) |
| ICE Futures Europe (Commodities) | IPE | 10 minutes | ICE Futures E.U. - Commodities (IPE) |
| ICE Futures Europe (Financials) | ICEEU | 10 minutes | ICE Futures E.U. – Financials (LIFFE) |
| LSE | LSE | 15 minutes | LSE UK |
| LSEIOB | LSEIOB | 15 minutes | LSE International |
| MEFF | MEFF | 15 minutes | BME (MEFF) |
| NASDAQ OMX Nordic Derivatives | OMS | 15 minutes | Nordic Derivatives |
| Prague Stock Exchange | PRA | 15 minutes | Prague Stock Exchange Cash Market |
| SWISS Exchange | EBS/VIRTX | 15 minutes | SIX Swiss Exchange |
| Tel Aviv Stock Exchange | TASE | 15 minutes | Tel Aviv Stock Exchange |
| Turquoise ECN | TRQXCH/TRQXDE/TRQXEN | 15 minutes | Turquoise ECNs |
| Warsaw Stock Exchange | WSE | 15 minutes | Warsaw Stock Exchange |
Asie
| Nom de la Bourse externe | Nom de la Bourse IB | Différé | Abonnement en temps réel |
| Australian Stock Exchange | ASX | 20 minutes | Total ASX |
| Hang Seng Indices | HKFE-IND | 15 minutes | Hang Seng Indexes |
| Hong Kong Futures Exchange | HKFE | 15 minutes | Hong Kong Derivatives (Fut & Opt) |
| Hong Kong Stock Exchange | SEHK | 15 minutes | Hong Kong Securities Exchange (Actions, Warrants & Obligations) |
| Korea Stock Exchange | KSE | 20 minutes | Korea Stock Exchange |
| National Stock Exchange of India | NSE | 15 minutes | National Stock Exchange of India, Capital Market Segment |
| Osaka Securities Exchange | OSE.JPN | 20 minutes | Osaka Exchange |
| SGX Derivatives | SGX | 10 minutes | Singapore Exchange (SGX) - Derivatives |
| Shanghai Stock Exchange | SEHKNTL | 15 minutes | Shanghai Stock Exchange |
| Shanghai Stock Exchange STAR Market | SEHKSTAR | 15 minutes | Shanghai Stock Exchange |
| Shenzhen Stock Exchange | SEHKSZSE | 15 minutes | Shenzhen Stock Exchange |
| Singapore Stock Exchange | SGX | 10 minutes | Singapore Exchange (SGX) - Stocks |
| Sydney Futures Exchange | SNFE | 10 minutes | ASX24 Commodities and Futures |
| Tokyo Stock Exchange | TSEJ | 20 minutes | Tokyo Stock Exchange |
Présentation des frais
Nous recommandons aux clients ainsi qu'aux clients éventuels de consulter notre site où les frais sont exposés en détails.
Ci-dessous une présentation des frais les plus communs :
1. Commissions - varient en fonction du type de produit et de la bourse et si vous avez choisi un régime en forfait ou sans forfait. Dans le cas des actions des États-Unis, par exemple, nous facturons 0.005 $ par action avec un minimum de 1.00 $ par transaction.
2. Intérêt - l'intérêt est facturé sur les soldes débiteurs sur marge et IBKR utilise des benchmarks internationalement reconnus sur les dépôts overnight comme base pour déterminer les taux d'intérêts. Nous appliquons ensuite un spread autour du taux d'intérêt référence (« BM ») par niveau, pour que les soldes plus importants reçoivent de taux toujours meilleurs, pour déterminer un taux effectif. Par exemple, dans le cas de prêts libellés en USD, tle taux de référence est le taux effectif du Fed Funds et un spread de 1.5 % est ajouté au benchmark pour les soldes jusqu'à 100,000 $. De plus, les individus pratiquant la vente à découvert doivent être conscients des frais spéciaux exprimés en intérêts journaliers où l'action empruntée pour couvrir la vente à découvert est considérée comme « difficile à emprunter ».
3. Frais de Bourse - varient également selon le type de produit et la bourse. Par exemple, dans le cas d'options sur actions US, certaines bourses facturent des frais pour le retrait de liquidités (ordres au marché ou ordres limites négociables) et fournissent des paiements pour les ordres qui ajoutent des liquidités (ordre limite). De plus, de nombreuses bourses facturent des frais pour les ordres annulés ou modifiés.
4. Données de marché - vous n'êtes pas tenu de vous abonner aux données de marché, mais si vous le faites vous pourrez être soumis à des frais mensuels qui dépendront du prestataire et de son offre d'abonnement. Nous proposons un outil Assistant de données de marché qui vous aide à choisir le service d'abonnement aux données de marché qui vous convient selon le produit que vous souhaiter trader. Pour y accéder, connectez-vous au Portail, cliquez sur la section Assistance puis sur le lien Assistant de données de marché
5. Frais minimums mensuels d'activité - comme nous proposons nos services à des traders actifs, nous exigeons que les comptes génèrent un minimum en commissions par mois ou qu'ils soient facturés de la différence en frais d'activité. Le minimum est de 10 $ par mois.
6. Divers - IBKR autorise un retrait gratuit par mois et facture des frais pour tout autre retrait ultérieur. De plus, certains frais sont répercutés pour les demandes de transactions annulées, exercice et attributions d'options et de contrats à terme et frais de garde ADR.
Pour plus d'informations, consultez notre site et sélectionnez une option dans le menu Tarification.
VR(T) time decay and term adjusted Vega columns in Risk Navigator (SM)
Background
Risk Navigator (SM) has two Adjusted Vega columns that you can add to your report pages via menu Metrics → Position Risk...: "Adjusted Vega" and "Vega x T-1/2". A common question is what is our in-house time function that is used in the Adjusted Vega column and what is the aim of these columns. VR(T) is also generally used in our Stress Test or in the Risk Navigator custom scenario calculation of volatility index options (i.e VIX).
Abstract
Implied volatilities of two different options on the same underlying can change independently of each other. Most of the time the changes will have the same sign but not necessarily the same magnitude. In order to realistically aggregate volatility risk across multiple options into a single number, we need an assumption about relationship between implied volatility changes. In Risk Navigator, we always assume that within a single maturity, all implied volatility changes have the same sign and magnitude (i.e. a parallel shift of volatility curve). Across expiration dates, however, it is empirically known that short term volatility exhibits a higher variability than long term volatility, so the parallel shift is a poor assumption. This document outlines our approach based on volatility returns function (VR(T)). We also describe an alternative method developed to accommodate different requests.
VR(T) time decay
We applied the principal component analysis to study daily percentage changes of volatility as a function of time to maturity. In that study we found that the primary eigen-mode explains approximately 90% of the variance of the system (with second and third components explaining most of the remaining variance being the slope change and twist). The largest amplitude of change for the primary eigenvector occurs at very short maturities, and the amplitude monotonically decreases as time to expiration increase. The following graph shows the main eigenvector as a function of time (measured in calendar days). To smooth the numerically obtained curve, we parameterize it as a piecewise exponential function.

Functional Form: Amplitude vs. Calendar Days
To prevent the parametric function from becoming vanishingly small at long maturities, we apply a floor to the longer term exponential so the final implementation of this function is:
where bS=0.0180611, a=0.365678, bL=0.00482976, and T*=55.7 are obtained by fitting the main eigenvector to the parametric formula.
Inverse square root time decay
Another common approach to standardize volatility moves across maturities uses the factor 1/√T. As shown in the graph below, our house VR(T) function has a bigger volatility changes than this simplified model.

Time function comparison: Amplitude vs. Calendar Days
Adjusted Vega columns
Risk Navigator (SM) reports a computed Vega for each position; by convention, this is the p/l change per 1% increase in the volatility used for pricing. Aggregating these Vega values thus provides the portfolio p/l change for a 1% across-the-board increase in all volatilities – a parallel shift of volatility.
However, as described above a change in market volatilities might not take the form of a parallel shift. Empirically, we observe that the implied volatility of short-dated options tends to fluctuate more than that of longer-dated options. This differing sensitivity is similar to the "beta" parameter of the Capital Asset Pricing Model. We refer to this effect as term structure of volatility response.
By multiplying the Vega of an option position with an expiry-dependent quantity, we can compute a term-adjusted Vega intended to allow more accurate comparison of volatility exposures across expiries. Naturally the hoped-for increase in accuracy can only come about if the adjustment we choose turns out to accurately model the change in market implied volatility.
We offer two parametrized functions of expiry which can be used to compute this Vega adjustment to better represent the volatility sensitivity characteristics of the options as a function of time to maturity. Note that these are also referred as 'time weighted' or 'normalized' Vega.
Adjusted Vega
A column titled "Vega Adjusted" multiplies the Vega by our in-house VR(T) term structure function. This is available any option that is not a derivative of a Volatility Product ETP. Examples are SPX, IBM, VIX but not VXX.
Vega x T-1/2
A column for the same set of products as above titled "Vega x T-1/2" multiplies the Vega by the inverse square root of T (i.e. 1/√T) where T is the number of calendar days to expiry.
Aggregations
Cross over underlying aggregations are calculated in the usual fashion given the new values. Based on the selected Vega aggregation method we support None, Straight Add (SA) and Same Percentage Move (SPM). In SPM mode we summarize individual Vega values multiplied by implied volatility. All aggregation methods convert the values into the base currency of the portfolio.
Custom scenario calculation of volatility index options
Implied Volatility Indices are indexes that are computed real-time basis throughout each trading day just as a regular equity index, but they are measuring volatility and not price. Among the most important ones is CBOE's Marker Volatility Index (VIX). It measures the market's expectation of 30-day volatility implied by S&P 500 Index (SPX) option prices. The calculation estimates expected volatility by averaging the weighted prices of SPX puts and calls over a wide range of strike prices.
The pricing for volatility index options have some differences from the pricing for equity and stock index options. The underlying for such options is the expected, or forward, value of the index at expiration, rather than the current, or "spot" index value. Volatility index option prices should reflect the forward value of the volatility index (which is typically not as volatile as the spot index). Forward prices of option volatility exhibit a "term structure", meaning that the prices of options expiring on different dates may imply different, albeit related, volatility estimates.
For volatility index options like VIX the custom scenario editor of Risk Navigator offers custom adjustment of the VIX spot price and it estimates the scenario forward prices based on the current forward and VR(T) adjusted shock of the scenario adjusted index on the following way.
- Let S0 be the current spot index price, and
- S1 be the adjusted scenario index price.
- If F0 is the current real time forward price for the given option expiry, then
- F1 scenario forward price is F1 = F0 + (S1 - S0) x VR(T), where T is the number of calendar days to expiry.
VOLUME – Calculation of Shares Traded
At first glance, the number of shares executed in a given time period would seem to be a straightforward calculation. The simplest definition of volume is the number of shares traded from one point in time to another point in time. However, several variables affect the calculation.
Market conditions may cause a calculation of volume to differ among data providers. For example, the two plans that manage the US Consolidated equities market have different number of, and definition for, trade reporting codes. In addition, data distributors often include variables such as odd lots, corrections, cash trades, or pre-/post-market trades in the volume calculation.
Numbers can become more visible in light volume or over time. For example, what was volume as of 09:37?
| Time | Symbol | Quantity | Price |
| 9:35 | XYZ | 1000 | 19.90 |
| 9:36 | XYZ | -1000 | 19.90 |
| 9:37 | XYZ | 1000 | 19.80 |
Depending on the distributor, the volume at 09:37 could be:
- 1000 shares if the distributor corrects the volume for corrections
- 2000 shares if the distributor only counts positive numbers
- 3000 shares if the distributor reflects the total of all prints expressed as a positive number
This may be a simplified example, but understanding how a distributor calculates volume will help the volume calculation serve as an indicator of market direction.
Alternative Streaming Quotes for US Equities
The SEC Vendor Display Rule requires that brokers give clients access to the NBBO at the point of order entry. In order to provide users with free live streaming market data, we cannot display this free stream when entering an order without the client subscribing to the paid NBBO. Please note, this does not apply to non-IBLLC clients.
Under the Rule 603(c) of Regulation NMS (Vendor Display Rule), when a broker is providing quotation information to clients that can be used to assess the current market or the quality of trade execution, reliance on non-consolidated market information as the source of that quotation would not be consistent with the Vendor Display Rule.
All clients (IBKR Lite and Pro) have access to streaming real-time US equity quotes from Cboe One and IEX at no charge. Since this data does not include all markets, we cannot show this quote when entering parameters for a US stock quote. Therefore and according to FINRA's enforcement of the SEC rule, IBKR provides IBLLC US clients a free default snapshot service, “US Snapshots VDR Required”. If clients do not sign up for an NBBO US equity data service and they are an IBLLC client, they will have access to free real-time snapshots when making trading decisions on US stocks. Order routing will not change based on what is shown on the screen. If one is subscribed to NBBO quotes or not, by default the trade will still take place with the assistance of the SMART order router designed to provide the best price for the order.
Please see the sample screenshots below from TWS Classic and TWS Mosaic for what occurs when placing an order without the NBBO streaming subscription for US equities.
TWS Classic:
1. Screenshot of quotes showing without order entry line item
2. Screenshot of quote going blank when putting in the order entry line item
TWS Mosaic:
1. Screenshot of quotes showing without order entry line item
2. Screenshot of quote going blank when putting in the order entry line item
Données de marché en Aperçu
CONTEXTE
IBKR propose aux clients éligibles la possibilité de recevoir des cotations en temps réel sur demande pour un instrument. Ce service, appelé « Cotations en Aperçu », diffère des services traditionnels de cotation qui offrent un flux continu et des mises à jour en temps réel des prix. Les cotations en aperçu sont offertes comme une alternative à bas coût aux clients qui ne tradent pas régulièrement et ne veulent pas dépendre de cotations en différé1 lorsqu'ils soumettent un ordre. Des informations supplémentaires concernant ce service de cotation sont fournies ci-dessous.
Éléments de la cotation
Une cotation en Aperçu comporte les données suivantes :
- Dernier prix
- Dernier volume
- Dernière Bourse
- Cours acheteur-vendeur actuel
- Volume pour chacun des cours acheteur-vendeur actuels
- Bourse pour chacun des cours vendeur-acheteur actuels
SERVICES DISPONIBLES
| Service | Restrictions | Prix par demande de cotation (USD)2 |
|---|---|---|
| AMEX (Network B/CTA) | 0.01 $ | |
| Total ASX | Pas d'accès à ASX24. Limité aux abonnés non professionnels |
0.03 $ |
| Bolsa de Madrid | 0.03 $ | |
| Canadian Exchange Group (TSX/TSXV) | Limité aux abonnés non professionnels qui ne sont pas des clients d'IB Canada | 0.03 $ |
| CBOT Real-Time | 0.03 $ | |
| CME Real-Time | 0.03 $ | |
| COMEX Real-Time | 0.03 $ | |
| Eurex Core | Limité aux abonnés non professionnels | 0.03 $ |
| Euronext Basic | Limité aux abonnés non professionnels Inclut les titres, indices, dérivés de titres et dérivés d'indices Euronext. |
0.03 $ |
| Indices et ETF allemands | Limité aux abonnés non professionnels | 0.03 $ |
| Dérivés de Hong Kong (HKFE) | 0.03 $ | |
| Hong Kong Securities Exchange (Actions, Warrants, Obligations) | 0.03 $ | |
| Johannesburg Stock Exchange | 0.03 $ | |
| Dérives de Montreal | Limité aux abonnés non professionnels | 0.03 $ |
| NASDAQ (Network C/UTP) | 0.01 $ | |
| Nordic Derivatives | 0.03 $ | |
| Nordic Equity | 0.03 $ | |
| NYMEX Real-Time | 0.03 $ | |
| NYSE (Network A/CTA) | 0.01 $ | |
| OPRA (US Options Exchanges) | 0.03 $ | |
| Shanghai Stock Exchange 5 Second Snapshot (via HKEx) | 0.03 $ | |
| Shenzhen Stock Exchange 3 Second Snapshot (via HKEx) | 0.03 $ | |
| SIX Swiss Exchange | Limité aux abonnés non professionnels | 0.03 $ |
| Allemagne Spot Market (Francfort/Xetra) | Limité aux abonnés non professionnels | 0.03 $ |
| Indices en temps réel STOXX | Limité aux abonnés non professionnels | 0.03 $ |
| Toronto Stk Exchange | Limité aux abonnés non professionnels clients d'IB Canada | 0.03 $ |
| TSX Venture Exchange | Limité aux abonnés non professionnels clients d'IB Canada | 0.03 $ |
| UK LSE (IOB) Equities | 0.03 $ | |
| UK LSE Equities | 0.03 $ |
1Conformément aux exigences réglementaires, IBKR ne propose plus d'informations de cotation en différé sur les titres des États-Unis aux clients d'Interactive Brokers LLC.
2Le coût est indiqué par demande de cotation en Aperçu et sera facturé dans l'équivalent de la devise de base si celle-ci n'est pas l'USD.
ÉLIGIBILITÉ
- Les comptes doivent maintenir le l'abonnement minimum aux données de marché et les exigences de maintenance de solde de capital, afin d'être éligibles aux cotations en Aperçu.
- Les utilisateurs doivent avoir la version TWS 976.0 ou une version plus récente pour accéder aux fonctionnalités de cotations en Aperçu.
TARIFICATION
- Les clients recevront 1.00 $ de cotations en aperçu gratuitement chaque mois. Des aperçus peuvent être appliqués aux demandes de cotations aux États-Unis ou hors États-Unis et des frais s'appliqueront, sans préavis, lorsque la répartition gratuite sera terminée. Les clients peuvent consulter leur utilisation de l'aperçu à la clôture de chaque jour ouvré via le Portail Client.
- Les frais sont facturés en différé, généralement la première semaine après le mois pour lequel les services en Aperçu ont été fournis. Les comptes dont la trésorerie ou les titres avec valeur d'emprunt sont insuffisants pour couvrir les frais mensuels feront l'objet de liquidations de positions.
- Les frais mensuels pour les aperçus seront plafonnés au prix de service mensuel en temps réel correspondant. Les cotations en direct seront fournies sans coût supplémentaire pour le reste du mois. Le passage aux cotations en direct se fera à 18h30 EST environ, le jour ouvrable après que le plafond a été atteint pour l'Aperçu. À la fin du mois, le service de streaming prendra automatiquement fin et le compteur pour les données en Aperçu sera stoppé. Chaque service est plafonné indépendamment l'un de l'autre et les demandes de cotation pour un service ne peuvent être prises en compte pour déterminer le plafond d'un autre. Voir le tableau ci-dessous pour plus d'informations.
| Service | Prix par demande de cotation (USD) | Plafond pour abonnés non pro (Demandes/Coût total)2 | Plafond pour abonnés pro (Demandes/Coût total)3 |
|---|---|---|---|
| AMEX (Network B/CTA) | 0.01 $ | 150/1.50 $ | 2,300/23.00 $ |
| NASDAQ (Network C/UTP) | 0.01 $ | 150/1.50 $ | 2,500/25.00 $ |
| NYSE (Network A/CTA) | 0.01 $ | 150/1.50 $ | 4,500/45.00 $ |
DEMANDER DES COTATIONS EN APERÇU
Trading sur bureau - TWS (Classic) :
Si vous avez des données en différé affichées et que vous avez souscrit aux autorisations d'Aperçu, sous la colonne Action sur symbole vous verrez un bouton pour l'Aperçu :

Lorsque vous cliquez sur le bouton Aperçu, une fenêtre apparaîtra avec les détails de cotation. Cette fenêtre de détail des cotations générera un horodatage dès réception de la cotation NBBO pour le symbole, ainsi que des informations sur le NBBO :
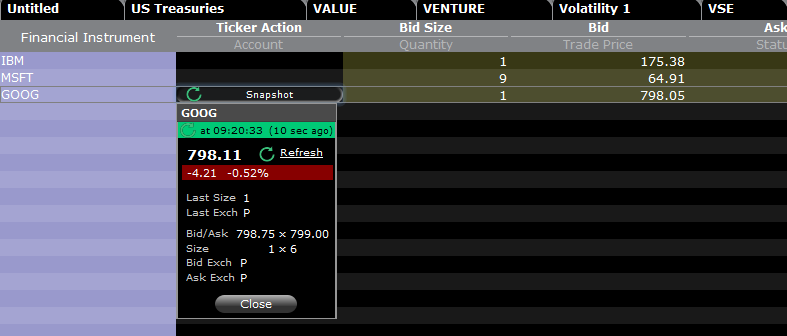
Dans la fenêtre du Détail de cotation, cliquez sur le lien Actualiser pour mettre à jour la cotation NBBO.
Exemple :
Dans le cas ci-dessus, GOOG est une action cotée sur NASDAQ (Network C/UTP). Des frais de 0.01 USD par demande (un aperçu) seront facturés.
- Les clients non professionnels peuvent demander jusqu'à 149 aperçus pour GOOG ou toutes autres actions cotées sur NASDAQ (Network C/UTP).
- Les professionnels peuvent demander 2,499 aperçus supplémentaires pour GOOG ou toutes autres actions cotées sur NASDAQ (Network C/UTP), avant qu'elles ne deviennent des cotations en streaming.
Vous ne serez facturés pour les aperçus qu'à hauteur du montant du plafond. Une fois ce plafond atteint, aucun autre frais ne sera appliqué pour le reste du mois et vous commencerez à recevoir des cotations en streaming pour ce service.
Trading sur bureau - TWS (Mosaic) :
Si vous avez des données en différé et que vous avez souscrit à des autorisations pour les aperçus, lorsque vous sélectionnez une ligne dans l'onglet de suivi, la fenêtre de saisie des ordres affichera l'option de demander un Aperçu.
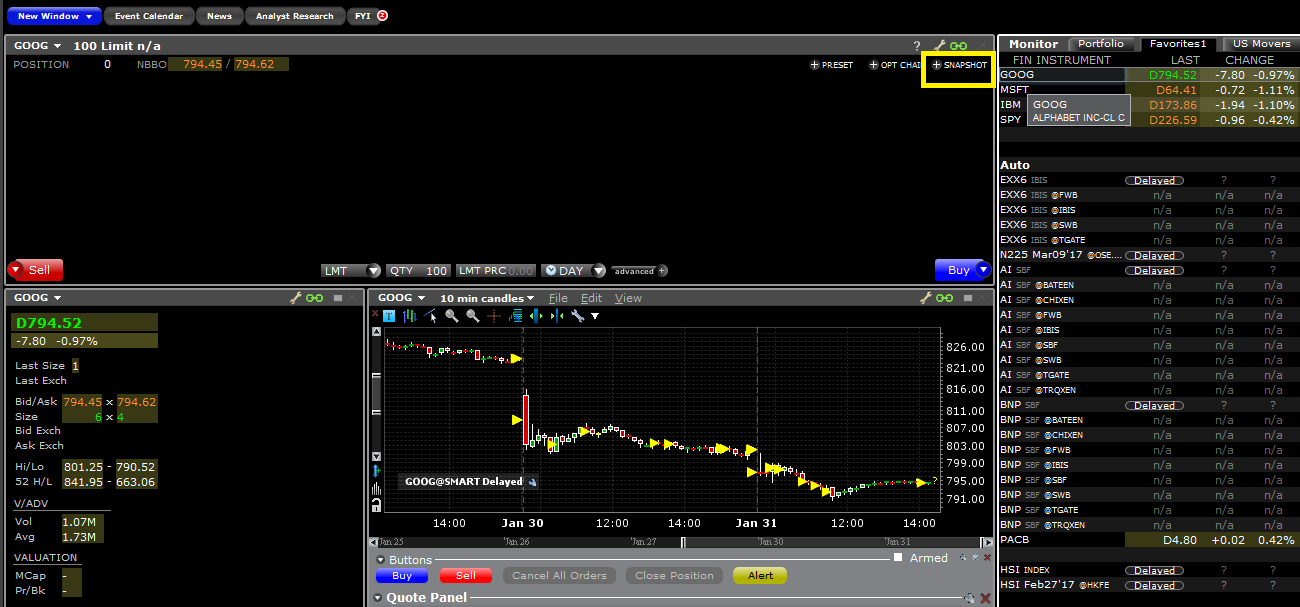
Lorsque vous cliquez sur le lien SNAPSHOT, une fenêtre se remplira de détails de cotations. Cette fenêtre de détail des cotations générera un horodatage dès réception de la cotation NBBO pour le symbole, ainsi que des informations sur le NBBO:
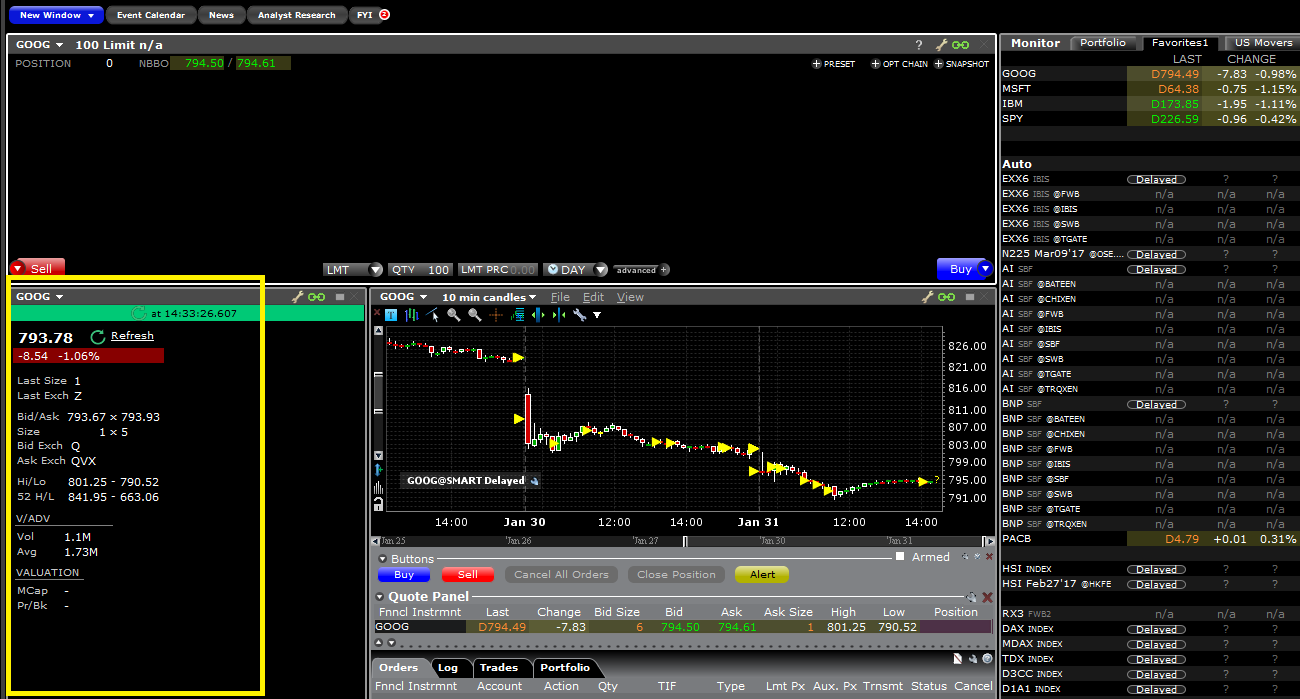
Dans la fenêtre du Détails de cotation, cliquez sur le lien Actualiser pour mettre à jour la cotation NBBO.
Portail Client :
Lorsque vous cliquez sur le lien Aperçu, une fenêtre se remplira des détails des cotations. Cette fenêtre de détail des cotations générera un horodatage dès réception de la cotation NBBO pour le symbole:
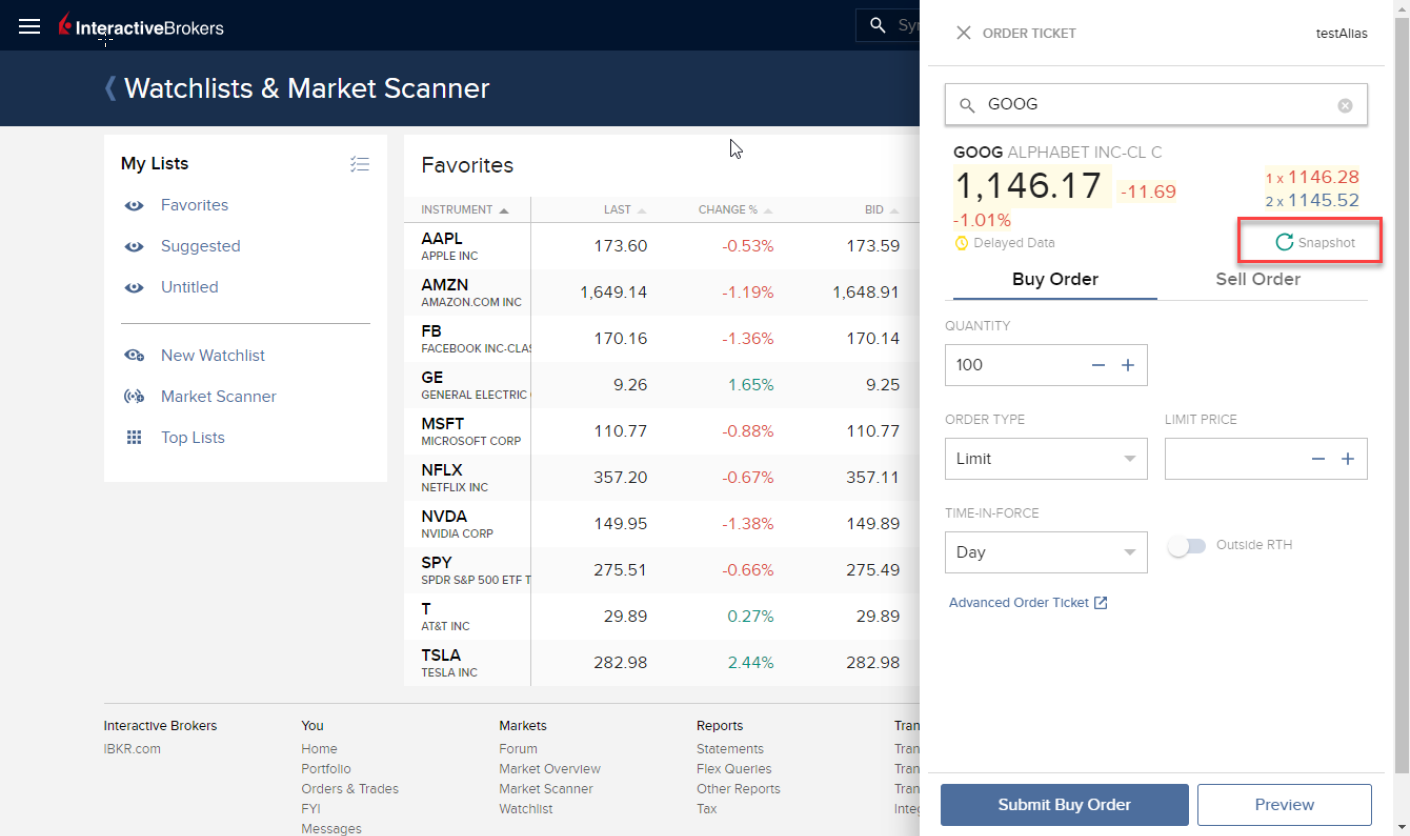
Lorsque vous cliquez sur le lien APERÇU, une fenêtre se remplira de détails des cotations. Cette fenêtre de détail des cotations générera un horodatage dès réception de la cotation NBBO pour le symbole :
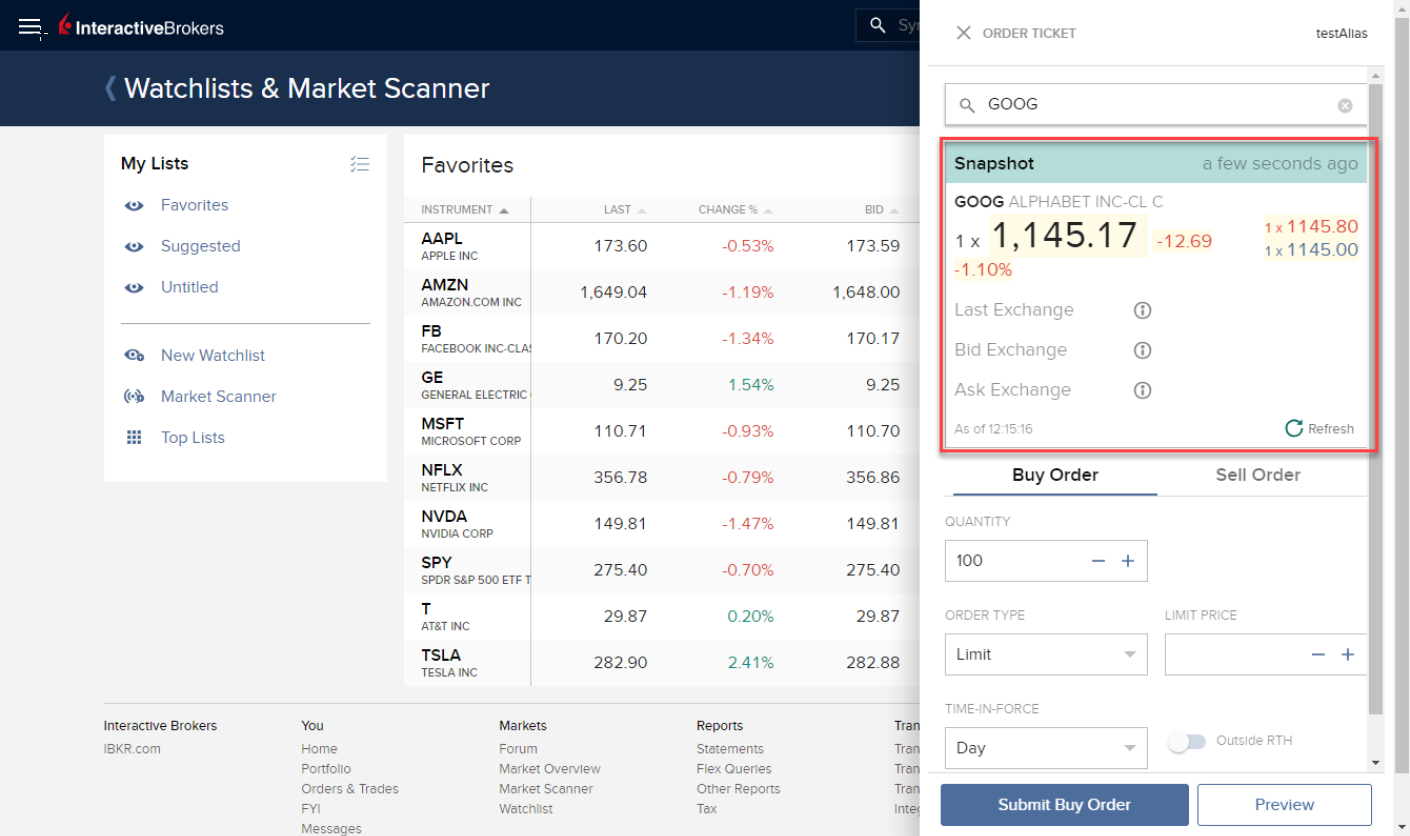
Dans la fenêtre de l'Aperçu, cliquez sur le lien Actualiser pour mettre à jour la cotation NBBO.
Trading sur le web - WebTrader :
Si vous avez des données en différé et que vous avez souscrit aux autorisations en Aperçu, sur l'onglet se trouvant sous la colonne Données supplémentaires vous verrez un bouton pour l'aperçu :
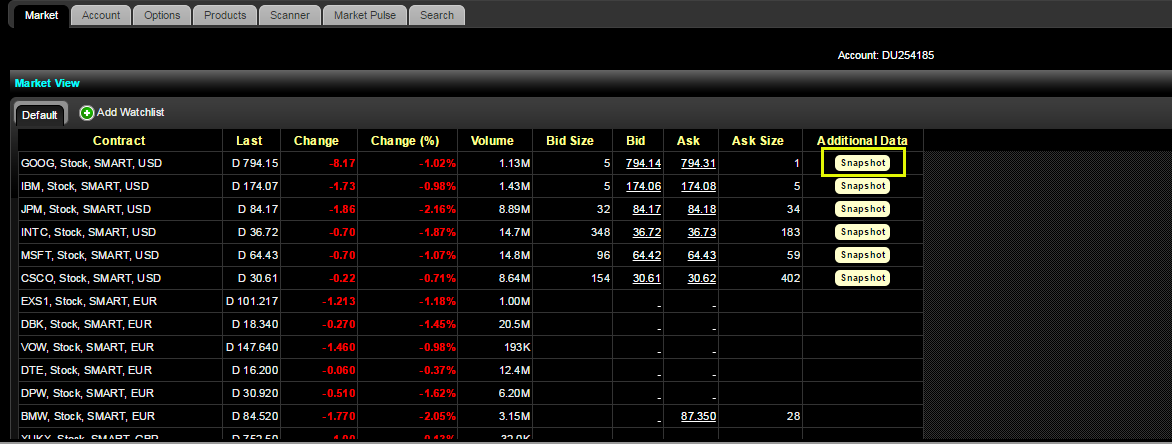
Lorsque vous cliquez sur le bouton Aperçu, une fenêtre apparaîtra avec les détails des cotations. Cette fenêtre de détail des cotations générera un horodatage dès réception de la cotation NBBO pour le symbole :
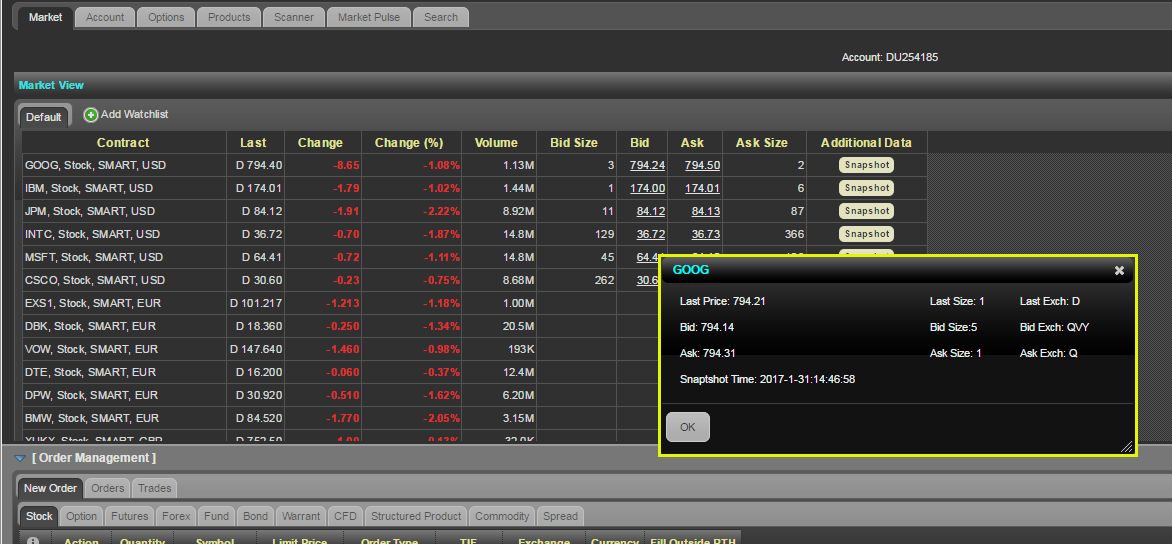
Trading mobile - Application IBKR :
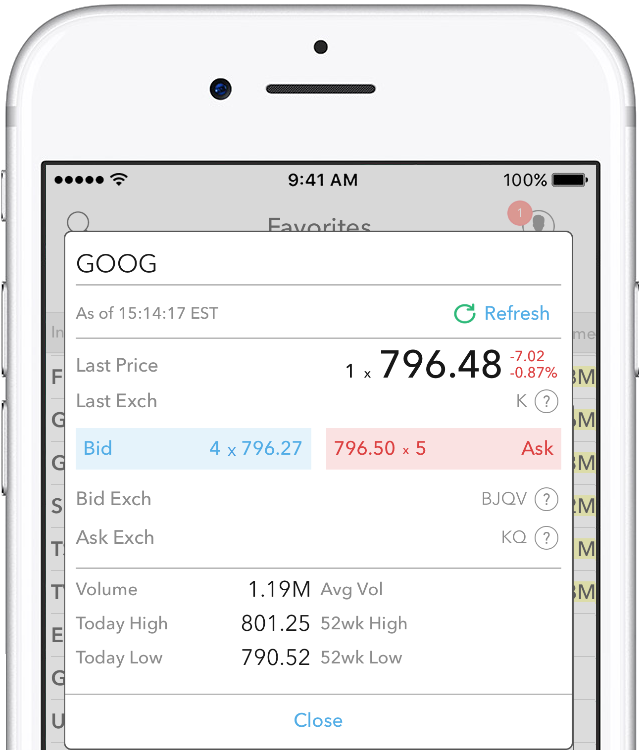
Sur l'écran de cotation, toucher le symbole agrandira la fenêtre de cotation. Si des données en différé s'affichent et que vous avez des autorisations pour les aperçus, vous verrez un lien pour Aperçu :
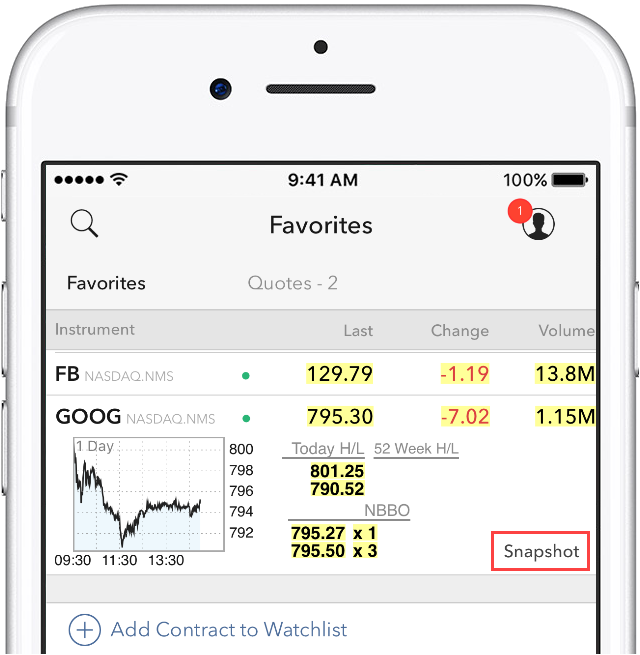
Lorsque vous cliquez sur le lien APERÇU, une fenêtre se remplira des détails des cotations. Cette fenêtre de détail des cotations générera un horodatage dès réception de la cotation NBBO pour le symbole, ainsi que des informations sur le NBBO :
