Alternative Streaming Quotes for European Equities
Alternative Streaming Quotes for EU Equities
On August 1st, 2022, clients with non-professional or non-commercial market data subscriber status will receive complimentary real-time streaming Best Bid and Offer and last sale quotes on European Equities. These quotes will be aggregated from exchanges such as Cboe Europe, Gettex, Tradegate and Turquoise. The data will display in the SMART quote line and can be used to generate a chart as well.
Eligible users will see a no charge service called 'Alternative European Equities (L1)' added to their account on or before August 1, 2022. Please note this will be a default Market Data service that cannot be removed.
Users who would like to receive the full EBBO (European Best Bid and Offer) will need to subscribe to the individual exchange subscriptions.
暗号通貨商品のマーケットデータ
株式/ETF
米国
GBTC @ PINK
- 一般投資家向け
- Level 1: OTC Markets (NP,L1)
- Level 1: US Securities Snapshot and Futures Value Bundle (NP,L1)
- Level 2: OTC Markets (NP,L2)
- Level 2: Global OTC and OTC Markets (NP,L2)
- 特定投資家向け
- Level 1: OTC Markets (P,L1)
- Level 1: Professional US Securities Snapshot Bundle (P,L1)
- Level 2: OTC Markets (P,L2)
- Level 2: Global OTC and OTC Markets (P,L2)
米国外
BITCOINXB @ SFB
- 一般投資家向け
- Level 1: Nordic Equity (NP,L1)
- Level 2: Nordic Equity (NP,L2)
- 特定投資家向け
- Level 1: Nordic Equity (P,L1)
- Level 2: Nordic Equity (P,L2)
COINETH @ SFB
- 一般投資家向け
- Level 1: Nordic Equity (NP,L1)
- Level 2: Nordic Equity (NP,L2)
- 特定投資家向け
- Level 1: Nordic Equity (P,L1)
- Level 2: Nordic Equity (P,L2)
COINETHE @ SFB
- 一般投資家向け
- Level 1: Nordic Equity (NP,L1)
- Level 2: Nordic Equity (NP,L2)
- 特定投資家向け
- Level 1: Nordic Equity (P,L1)
- Level 2: Nordic Equity (P,L2)
指数
BRR/BRTI @ CME
- 一般投資家向け
- CME Real-Time Non-Professional Level 1
- US Securities Snapshot and Futures Value Bundle (NP,L1)
- 特定投資家向け
- CME Real-Time Professional Level 2(CME Pro level 1商品はありません)
NYXBT @ FWB/SWB
- 一般投資家向け
- FWB: Spot Market Germany (Frankfurt/Xetra)(NP,L1)
- SWB: Stuttgart Boerse incl. Euwax (SWB) (NP,L1)
- 特定投資家向け
- FWB: Spot Market Germany (Frankfurt/Xetra) (P,L1)
- SWB: Stuttgart Boerse incl. Euwax (SWB) (P,L1)
先物
BRR @ CME
ETHUSDRR @ CME
- 一般投資家向け
- Level 1: CME Real-Time Non-Professional Level 1
- Level 1: US Securities Snapshot and Futures Value Bundle (NP,L1)
- Level 2: CME Real-Time Non-Professional Level 2
- Level 2: US Value Bundle PLUS (NP,L2)
- US Securities Snapshot and Futures Value Bundleが必要となります。
- 板情報用です。
- 特定投資家向け
- Level 2: CME Real-Time Professional Level 2(CME Pro level 1商品はありません)
BAKKT @ ICECRYPTO
- 一般投資家向け
- ICE Futures US (NP)
- 特定投資家向け
- ICE Futures US (P)
目次に戻る: IBKRにおけるビットコインおよびその他の暗号通貨商品
米国マーケットデータ購読(一般購読者)にあたっての考慮点
マーケットデータ購読の提供範囲の特定にあたり、IBKRでは取引商品の範囲と使用頻度の両方の観点より、様々なお客様のニーズのバランスを取るようにしています。お客様が米国データの月額料金を最小限に抑えることができるよう、弊社ではバンドルとアラカルトサービスの両方、またリアルタイムのストリーミングサービス、 スナップショット、遅延フィードをご提供しています。IBKRでは規制当局による要請に基づき、米国株の遅延クオート情報をインタラクティブ・ブローカーズLLCのお客様にご提供することができなくなりましたのでご了承ください。
どういった米国商品を取引していますか?
リアルタイムのクオートはどれくらいの頻度で利用をご希望ですか?
通常、月あたりに入る手数料はどれくらいになりますか?
どの取引所で取引しますか?
- US Equity and Options Add-On Streaming Bundle1: NYSE (Network A)、AMEX (Network B)、NASDAQ(Network C)、ならびにOPRA(US Options)を含みます。上記の取引所すべてに上場される証券を、頻繁に取引するユーザーを対象にしています。基本的なUS Securities Snapshot and Futures Value Bundle購読の提供するスナップショットクオートの代わりとなります。
遅延マーケットデータのタイミング
マーケットデータのベンダーは通常、リアルタイムと遅延タイプのふたつのカテゴリーに分けて、取引所データを提供しています。リアルタイムのマーケットデータは、情報が一般公開され次第に配信されます。遅延タイプのマーケットデータは、リアルタイムのクオートに通常、10分から20分遅れたものになります。
取引所の中には、マーケットデータ購読の費用は取らず、無料で遅延データを表示するところもあります。弊社にてリクエストを必要とせずに、遅延データを無料で提供(取引プラットフォームに商品のシンボルを入力すると遅延データが表示されます)している取引所は、以下の一覧のようになります。一覧には対応するリアルタイムの購読が含まれます。料金は弊社のウェブサイトよりご確認ください。
注意事項:
- 規制当局による要請に基づき、IBKRでは、米国株の遅延クオート情報をインタラクティブ・ブローカーズLLCのお客様にご提供することができなくなりました。
- 遅延データは取引のためではなく、参考としてご利用ください。記載される時間は予告なく変更されることがあります。
アメリカ大陸
| 外部での取引所名 | IBでの取引所名 | 遅延時間 | リアルタイム購読 |
| CBOT | CBOT | 10分 | CBOT Real-Time |
| CBOE Futures Exchange | CFE | 10分 | CFE Enhanced |
| Market Data Express (MDX) | CBOE | 10分 | CBOE Market Data Express Indices |
| CME | CME | 10分 | CME Real-Time |
| COMEX | COMEX | 10分 | COMEX Real-Time |
| ICE US | NYBOT | 10分 | ICE Futures U.S. (NYBOT) |
| Mexican Derivatives Exchange | MEXDER | 15分 | Mexican Derivatives Exchange |
| Mexican Stock Exchange | MEXI | 20分 | Mexican Stock Exchange |
| Montreal Exchange | CDE | 15分 | Montreal Exchange |
| NYMEX | NYMEX | 10分 | NYMEX Real-Time |
| NYSE GIF | NYSE | 15分 | NYSE Global Index Feed |
| One Chicago | ONE | 10分 | OneChicago |
| OPRA | OPRA | 15分 | OPRA Top of Book (L1) (US Option Exchanges) |
| OTC Markets | PINK | 15分 | OTC Markets |
| Toronto Stock Exchange | TSE | 15分 | Toronto Stock Exchange |
| Venture Exchange | VENTURE | 15分 | TSX Venture Exchange |
ヨーロッパ
| 外部での取引所名 | IBでの取引所名 | 遅延時間 | リアルタイム購読 |
| BATS Europe | BATE/CHIX | 15分 | European (BATS/Chi-X) Equities |
| Boerse Stuttgart | SWB | 15分 | Stuttgart Boerse incl. Euwax (SWB) |
| Bolsa de Madrid | BM | 15分 | Bolsa de Madrid |
| Borsa Italiana | BVME/IDEM | 15分 | Borsa Italiana (BVME stock / SEDEX / IDEM deriv) |
| Budapest Stock Exchange | BUX | 15分 | Budapest Stock Exchange |
| Eurex | EUREX | 15分 | Eurex Real-Time Information |
| Euronext | AEB/SBF/MATIF/BELFOX | 15分 | Euronext Cash |
| Euronext | AEB/SBF/MATIF/BELFOX | 15分 | Euronext Data Bundle |
| Frankfurt Stock Exchange and XETRA | FWB/IBIS/XETRA | 15分 | Spot Market Germany (Frankfurt/Xetra) |
| ICE Futures Europe (Commodities) | IPE | 10分 | ICE Futures E.U. - Commodities (IPE) |
| ICE Futures Europe (Financials) | ICEEU | 10分 | ICE Futures E.U. – Financials (LIFFE) |
| LSE | LSE | 15分 | LSE UK |
| LSEIOB | LSEIOB | 15分 | LSE International |
| MEFF | MEFF | 15分 | BME (MEFF) |
| NASDAQ OMX Nordic Derivatives | OMS | 15分 | Nordic Derivatives |
| Prague Stock Exchange | PRA | 15分 | Prague Stock Exchange Cash Market |
| SWISS Exchange | EBS/VIRTX | 15分 | SIX Swiss Exchange |
| Tel Aviv Stock Exchange | TASE | 15分 | Tel Aviv Stock Exchange |
| Turquoise ECN | TRQXCH/TRQXDE/TRQXEN | 15分 | Turquoise ECNs |
| Warsaw Stock Exchange | WSE | 15分 | Warsaw Stock Exchange |
アジア
| 外部での取引所名 | IBでの取引所名 | 遅延 時間 | リアルタイム購読 |
| Australian Stock Exchange | ASX | 20分 | ASX Total |
| Hang Seng Indices | HKFE-IND | 15分 | Hang Seng Indexes |
| Hong Kong Futures Exchange | HKFE | 15分 | Hong Kong Derivatives (Fut & Opt) |
| Hong Kong Stock Exchange | SEHK | 15分 | Hong Kong Securities Exchange (Stocks, Warrants & Bonds) |
| Korea Stock Exchange | KSE | 20分 | Korea Stock Exchange |
| National Stock Exchange of India | NSE | 15分 | National Stock Exchange of India, Capital Market Segment |
| Osaka Securities Exchange | OSE.JPN | 20分 | Osaka Exchange |
| SGX Derivatives | SGX | 10分 | Singapore Exchange (SGX) - Derivatives |
| Shanghai Stock Exchange | SEHKNTL | 15分 | Shanghai Stock Exchange |
| Shanghai Stock Exchange STAR Market | SEHKSTAR | 15分 | Shanghai Stock Exchange |
| Shenzhen Stock Exchange | SEHKSZSE | 15分 | Shenzhen Stock Exchange |
| Singapore Stock Exchange | SGX | 10分 | Singapore Exchange (SGX) - Stocks |
| Sydney Futures Exchange | SNFE | 10分 | ASX24 Commodities and Futures |
| Tokyo Stock Exchange | TSEJ | 20分 | Tokyo Stock Exchange |
証券に利用可能なマーケットデータ購読の見分け方
IBKRでは、口座をお持ちのお客様に、取引をご希望の証券(株式、オプション、またはワラント)に利用可能な購読サービスを選択するためのマーケットデータアシスタントツールをご提供しています。検索結果には商品の取引される取引所すべて、プロフェッショナルおよび一般購読者のお客様向けの購読とその月額料金、またそれぞれの購読に関連する市場の変動の深さが表示されます。
マーケットデータアシスタンスへのアクセス方法:
- クライアント・ポータルにログインしてください
- サポートセンターに続いて、ヘルプ(右上端のクスチョンマークのアイコン)をクリックしてください
- 下にスクロールして、マーケットデータアシスタントを選択してください
- シンボルかISINを入力してから取引所を入力してください
- 任意のフィルターに入力する内容を選択してください: プロフェッショナル/一般購読者のステータス、通貨、資産
- 検索をクリックしてください
- 検索結果より購読可能なものを確認し、ご自身のニーズに合ったものを選択してください
諸費用に関する概要
お客様および将来的に弊社のご利用をお考えの方は、料金の詳細が記載されている、弊社のウェブサイトをご覧いただくことをお勧め致します。
最も共通的な手数料や諸費用の概要は以下のようになります:
1. 手数料 - 商品の種類や上場取引所、またセットプラン(すべて一括)や別プランかなどの選択によって異なります。例えば米国株の場合、取引あたり$1.00を最低限として、1株あたり$0.005を手数料として設定しています。
2. 金利 - 証拠金によるマイナス残高には金利がかかりますが、弊社では国際的に認められたオーバーナイトのベンチマークを使用して金利を決定しています。さらに、ベンチマーク金利(「BM」)にスプレッドを適用し、残高が大きいほど金利が高くなるように設定して、実効レートを決定しています。 例えば、米ドル建てのローンの場合、ベンチマーク率はフェドファンドの実行レートで残高が10万ドル以下の場合には、ベンチマーク1.5%のスプレッドが追加されます。 また株式の空売りの際には、これをカバーするために借りた株式が「借入困難な銘柄」とみなされる場合、日次で表示される特別な手数料が適用されます。
3. 取引所手数料 - これもまた商品の種類や上場取引所によって異なります。例えば、米国の証券オプションの取引所では、流動性が失われると(成行注文または約定のつく指値注文)支払い手数料が発生し、また流動性が追加されると(指値注文)受取り手数料が発生することがあります。また、多くの取引所では注文のキャンセルや変更に手数料を設けています。
4. マーケットデータ - マーケットデータのご購読は必要ありませんが、購読する場合には、ベンダーの取引所と購読サービスによっては月額料金が発生することがあります。弊社では、お客様が取引を希望される商品に応じて、適切なマーケットデータ購読サービスを選択するための、マーケットデータ・アシスタントツールをご提供しています。ポータルにログインしてサポートの項目をクリックし、マーケットデータ・アシスタントのリンクを選択してください。
5. 月間最低アクティビティ手数料 - 弊社ではアクティブなトレーダーのお客様を対象としているため、毎月最低額の手数料が発生しない場合には、差額をアクティビティ手数料としてお支払いいただきます。最低額は月あたり$10です。
6. その他の諸費用 - IBKRでは月に1回の出金は無料になっていますが、それ以降の出金には手数料が設定されています。また、取引のバスト・リクエストやオプションや先物の権利行使や割当て、ADRカストディアン手数料など、お客様にパススルーされる手数料があります。
さらに詳しい情報は、弊社ウェブサイトの「諸費用・海外口座手数料」のメニューより該当するオプションを選択してご確認ください。
VR(T) time decay and term adjusted Vega columns in Risk Navigator (SM)
Background
Risk Navigator (SM) has two Adjusted Vega columns that you can add to your report pages via menu Metrics → Position Risk...: "Adjusted Vega" and "Vega x T-1/2". A common question is what is our in-house time function that is used in the Adjusted Vega column and what is the aim of these columns. VR(T) is also generally used in our Stress Test or in the Risk Navigator custom scenario calculation of volatility index options (i.e VIX).
Abstract
Implied volatilities of two different options on the same underlying can change independently of each other. Most of the time the changes will have the same sign but not necessarily the same magnitude. In order to realistically aggregate volatility risk across multiple options into a single number, we need an assumption about relationship between implied volatility changes. In Risk Navigator, we always assume that within a single maturity, all implied volatility changes have the same sign and magnitude (i.e. a parallel shift of volatility curve). Across expiration dates, however, it is empirically known that short term volatility exhibits a higher variability than long term volatility, so the parallel shift is a poor assumption. This document outlines our approach based on volatility returns function (VR(T)). We also describe an alternative method developed to accommodate different requests.
VR(T) time decay
We applied the principal component analysis to study daily percentage changes of volatility as a function of time to maturity. In that study we found that the primary eigen-mode explains approximately 90% of the variance of the system (with second and third components explaining most of the remaining variance being the slope change and twist). The largest amplitude of change for the primary eigenvector occurs at very short maturities, and the amplitude monotonically decreases as time to expiration increase. The following graph shows the main eigenvector as a function of time (measured in calendar days). To smooth the numerically obtained curve, we parameterize it as a piecewise exponential function.

Functional Form: Amplitude vs. Calendar Days
To prevent the parametric function from becoming vanishingly small at long maturities, we apply a floor to the longer term exponential so the final implementation of this function is:
where bS=0.0180611, a=0.365678, bL=0.00482976, and T*=55.7 are obtained by fitting the main eigenvector to the parametric formula.
Inverse square root time decay
Another common approach to standardize volatility moves across maturities uses the factor 1/√T. As shown in the graph below, our house VR(T) function has a bigger volatility changes than this simplified model.

Time function comparison: Amplitude vs. Calendar Days
Adjusted Vega columns
Risk Navigator (SM) reports a computed Vega for each position; by convention, this is the p/l change per 1% increase in the volatility used for pricing. Aggregating these Vega values thus provides the portfolio p/l change for a 1% across-the-board increase in all volatilities – a parallel shift of volatility.
However, as described above a change in market volatilities might not take the form of a parallel shift. Empirically, we observe that the implied volatility of short-dated options tends to fluctuate more than that of longer-dated options. This differing sensitivity is similar to the "beta" parameter of the Capital Asset Pricing Model. We refer to this effect as term structure of volatility response.
By multiplying the Vega of an option position with an expiry-dependent quantity, we can compute a term-adjusted Vega intended to allow more accurate comparison of volatility exposures across expiries. Naturally the hoped-for increase in accuracy can only come about if the adjustment we choose turns out to accurately model the change in market implied volatility.
We offer two parametrized functions of expiry which can be used to compute this Vega adjustment to better represent the volatility sensitivity characteristics of the options as a function of time to maturity. Note that these are also referred as 'time weighted' or 'normalized' Vega.
Adjusted Vega
A column titled "Vega Adjusted" multiplies the Vega by our in-house VR(T) term structure function. This is available any option that is not a derivative of a Volatility Product ETP. Examples are SPX, IBM, VIX but not VXX.
Vega x T-1/2
A column for the same set of products as above titled "Vega x T-1/2" multiplies the Vega by the inverse square root of T (i.e. 1/√T) where T is the number of calendar days to expiry.
Aggregations
Cross over underlying aggregations are calculated in the usual fashion given the new values. Based on the selected Vega aggregation method we support None, Straight Add (SA) and Same Percentage Move (SPM). In SPM mode we summarize individual Vega values multiplied by implied volatility. All aggregation methods convert the values into the base currency of the portfolio.
Custom scenario calculation of volatility index options
Implied Volatility Indices are indexes that are computed real-time basis throughout each trading day just as a regular equity index, but they are measuring volatility and not price. Among the most important ones is CBOE's Marker Volatility Index (VIX). It measures the market's expectation of 30-day volatility implied by S&P 500 Index (SPX) option prices. The calculation estimates expected volatility by averaging the weighted prices of SPX puts and calls over a wide range of strike prices.
The pricing for volatility index options have some differences from the pricing for equity and stock index options. The underlying for such options is the expected, or forward, value of the index at expiration, rather than the current, or "spot" index value. Volatility index option prices should reflect the forward value of the volatility index (which is typically not as volatile as the spot index). Forward prices of option volatility exhibit a "term structure", meaning that the prices of options expiring on different dates may imply different, albeit related, volatility estimates.
For volatility index options like VIX the custom scenario editor of Risk Navigator offers custom adjustment of the VIX spot price and it estimates the scenario forward prices based on the current forward and VR(T) adjusted shock of the scenario adjusted index on the following way.
- Let S0 be the current spot index price, and
- S1 be the adjusted scenario index price.
- If F0 is the current real time forward price for the given option expiry, then
- F1 scenario forward price is F1 = F0 + (S1 - S0) x VR(T), where T is the number of calendar days to expiry.
VOLUME – Calculation of Shares Traded
At first glance, the number of shares executed in a given time period would seem to be a straightforward calculation. The simplest definition of volume is the number of shares traded from one point in time to another point in time. However, several variables affect the calculation.
Market conditions may cause a calculation of volume to differ among data providers. For example, the two plans that manage the US Consolidated equities market have different number of, and definition for, trade reporting codes. In addition, data distributors often include variables such as odd lots, corrections, cash trades, or pre-/post-market trades in the volume calculation.
Numbers can become more visible in light volume or over time. For example, what was volume as of 09:37?
| Time | Symbol | Quantity | Price |
| 9:35 | XYZ | 1000 | 19.90 |
| 9:36 | XYZ | -1000 | 19.90 |
| 9:37 | XYZ | 1000 | 19.80 |
Depending on the distributor, the volume at 09:37 could be:
- 1000 shares if the distributor corrects the volume for corrections
- 2000 shares if the distributor only counts positive numbers
- 3000 shares if the distributor reflects the total of all prints expressed as a positive number
This may be a simplified example, but understanding how a distributor calculates volume will help the volume calculation serve as an indicator of market direction.
Alternative Streaming Quotes for US Equities
The SEC Vendor Display Rule requires that brokers give clients access to the NBBO at the point of order entry. In order to provide users with free live streaming market data, we cannot display this free stream when entering an order without the client subscribing to the paid NBBO. Please note, this does not apply to non-IBLLC clients.
Under the Rule 603(c) of Regulation NMS (Vendor Display Rule), when a broker is providing quotation information to clients that can be used to assess the current market or the quality of trade execution, reliance on non-consolidated market information as the source of that quotation would not be consistent with the Vendor Display Rule.
All clients (IBKR Lite and Pro) have access to streaming real-time US equity quotes from Cboe One and IEX at no charge. Since this data does not include all markets, we cannot show this quote when entering parameters for a US stock quote. Therefore and according to FINRA's enforcement of the SEC rule, IBKR provides IBLLC US clients a free default snapshot service, “US Snapshots VDR Required”. If clients do not sign up for an NBBO US equity data service and they are an IBLLC client, they will have access to free real-time snapshots when making trading decisions on US stocks. Order routing will not change based on what is shown on the screen. If one is subscribed to NBBO quotes or not, by default the trade will still take place with the assistance of the SMART order router designed to provide the best price for the order.
Please see the sample screenshots below from TWS Classic and TWS Mosaic for what occurs when placing an order without the NBBO streaming subscription for US equities.
TWS Classic:
1. Screenshot of quotes showing without order entry line item
2. Screenshot of quote going blank when putting in the order entry line item
TWS Mosaic:
1. Screenshot of quotes showing without order entry line item
2. Screenshot of quote going blank when putting in the order entry line item
スナップショット・マーケットデータ
背景
IBKRでは対象となるお客様に、銘柄のリアルタイム価格クオートをリクエストできるサービスをご提供しています。「スナップショット・クオート」と呼ばれるこちらのサービスは、リアルタイム価格をストリーミングやアップデートごとに継続的に配信する従来のものとは異なります。スナップショット・クオートは、取引頻度が少ないものの注文発注の際に遅延データの利用をご希望されないお客様にお使いいただける、低コストなデータサービスとしてご提供しております1。詳細は以下をご覧ください。
クオートの要素
スナップショットのクオートには以下のデータが含まれます:
- 直近取引価格
- 直近数量
- 直近の取引所
- 現在のビッド-アスク
- 現在のビッド-アスクそれぞれの数量
- 現在のビッド-アスクそれぞれの取引所
利用可能サービス
| サービス | 制限 | クオートリクエストあたりの料金(USD)2 |
|---|---|---|
| AMEX (Network B/CTA) | $0.01 | |
| ASX Total | ASX24へのアクセスなし 一般投資家のみ利用可能 |
$0.03 |
| Bolsa de Madrid | $0.03 | |
| Canadian Exchange Group (TSX/TSXV) | IBカナダのクライアントではない一般投資家のみ利用可能 | $0.03 |
| CBOT Real-Time | $0.03 | |
| CME Real-Time | $0.03 | |
| COMEX Real-Time | $0.03 | |
| Eurex Core | 一般投資家のみ利用可能 | $0.03 |
| Euronext Basic | 一般投資家のみ利用可能 Euronextの株式、指数、株式派生商品、ならびに指数派生商品を含む |
$0.03 |
| German ETF's and Indices | 一般投資家のみ利用可能 | $0.03 |
| Hong Kong (HKFE) Derivatives | $0.03 | |
| Hong Kong Securities Exchange (Stocks, Warrants, Bonds) | $0.03 | |
| Johannesburg Stock Exchange | $0.03 | |
| Montreal Derivatives | 一般投資家のみ利用可能 | $0.03 |
| NASDAQ (Network C/UTP) | $0.01 | |
| Nordic Derivatives | $0.03 | |
| Nordic Equity | $0.03 | |
| NYMEX Real-Time | $0.03 | |
| NYSE (Network A/CTA) | $0.01 | |
| OPRA (US Options Exchanges) | $0.03 | |
| Shanghai Stock Exchange 5 Second Snapshot (via HKEx) | $0.03 | |
| Shenzhen Stock Exchange 3 Second Snapshot (via HKEx) | $0.03 | |
| SIX Swiss Exchange | 一般投資家のみ利用可能 | $0.03 |
| Spot Market Germany (Frankfurt/Xetra) | 一般投資家のみ利用可能 | $0.03 |
| STOXX Index Real-Time Data | 一般投資家のみ利用可能 | $0.03 |
| Toronto Stk Exchange | IBカナダのクライアントである一般投資家のみ利用可能 | $0.03 |
| TSX Venture Exchange | IBカナダのクライアントである一般投資家のみ利用可能 | $0.03 |
| UK LSE (IOB) Equities | $0.03 | |
| UK LSE Equities | $0.03 |
1規制当局による要請に基づき、IBKRでは、米国株の遅延クオート情報をインタラクティブ・ブローカーズLLCのお客様にご提供することができなくなりました。
2料金はスナップショット・クオートのリクエストあたりのものになり、基準通貨がUSDでない場合には、相当する額に計算されます。
参加資格
- スナップショット・クオートのリクエストには、マーケットデータの購読および維持に必要となる最低残高を保有している必要があります。
- スナップショット・クオート機能にはTWSバージョン976.0以上が必要です。
価格の詳細
- 毎月、$1.00分のスナップショットクオートが無料でご利用いただけます。無料スナップショットは、米国内および米国外のクオートリクエストに適用され、無料分を使い切った時点で通知なしに料金が適用されるようになります。スナップショットの使用料は、各営業日の終了時点でご確認いただくことができます。
- クオート料金の計算は後日になり、通常はスナップショットサービスが利用された翌月の一週目に発生します。月額料金をカバーする現金残高や貸付金額を含む資産価値が十分にない口座は、ポジション強制決済の対象になります。
- スナップショットの月額料金は、関連するリアルタイムのストリーミング用の月額サービス料金が上限となります。この時点より、その月の残り期間分のストリーミング・クオートが無料配信となります。ストリーミングサービスへは、スナップショットサービスの料金が上限に達した翌日の米国東部標準時18:30頃に切り替わります。ストリーミングサービスは月末の時点で自動的に終了し、リクエストベースのスナップショットサービスに対する料金計算が再開します。各サービスの上限は別計算となりますので、1回のクオートサービスで発生する料金が、別のタイプのサービスの上限計算に含まれることはありません。サンプルの詳細は以下の表をご覧ください。
| サービス | クオートリクエストあたりの料金(USD) | 一般投資家の上限(リクエスト/合計費用)2 | プロフェッショナル購読者の上限(リクエスト/合計費用)3 |
|---|---|---|---|
| AMEX (Network B/CTA) | $0.01 | 150/$1.50 | 2,300/$23.00 |
| NASDAQ (Network C/UTP) | $0.01 | 150/$1.50 | 2,500/$25.00 |
| NYSE (Network A/CTA) | $0.01 | 150/$1.50 | 4,500/$45.00 |
スナップショット・クオートのリクエスト
デスクトップ取引 - TWS(クラシック):
遅延データが表示されていて、スナップショット許可をお持ちの場合、ティッカーアクションのコラムの下にスナップショットボタンが現れます:

スナップショットボタンをクリックすると、クオート詳細のウィンドウが表示されます。シンボルのNBBOが受信され次第、クオート詳細のウィンドウがタイムスタンプを作成し、NBBO情報を含めるクオートの詳細がこのウィンドウに表示されます:
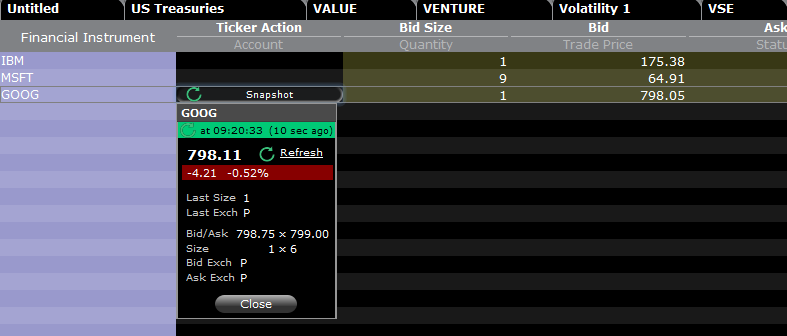
ウィンドウの更新リンクをクリックすると、NBBOクオートがアップデートされます。
例:
上記の例のGOOGは、NASDAQ(Network C/UTP)上場の株式になり、スナップショットのリクエストあたり0.01 USDが発生します。
- 一般購読家のお客様はGOOGのスナップショット、またはNASDAQ(Network C/UTP)上場のその他の株式のスナップショットをあと149回リクエストすることができ、これを超えるとストリーミングサービスに変わります。
- プロフェッショナルのお客様の場合はGOOGのスナップショット、またはNASDAQ(Network C/UTP)上場のその他の株式のスナップショットをあと2499回リクエストすることができ、これを超えるとストリーミングサービスに変わります。
上限額に達するまではスナップショットごとのご請求になりますが、上限額に達した時点でそのサービスに対する個別の料金計算はなくなり、ストリーミングサービスに変更されます。
デスクトップ取引 - TWS(モザイク):
遅延データが表示されていて、スナップショット許可をお持ちの場合、モニタータブ内の行を選択すると、注文入力ウィンドウにスナップショットのオプションが表示されます。
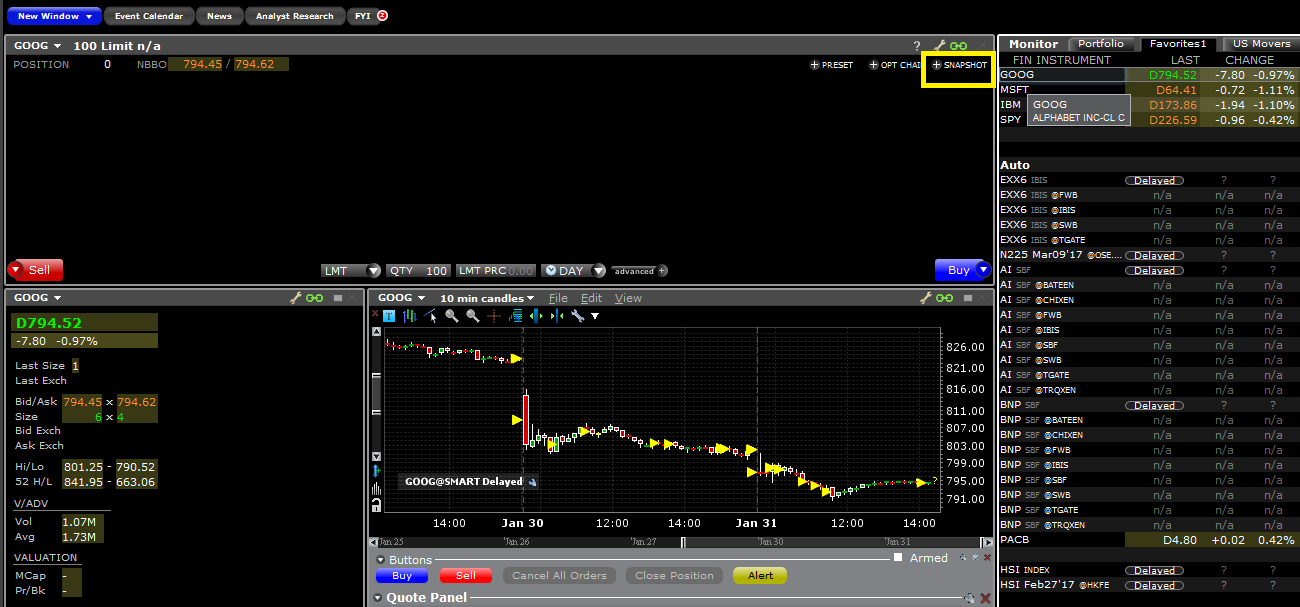
+スナップショットボタンをクリックすると、クオート詳細のウィンドウが表示されます。シンボルのNBBOが受信され次第、クオート詳細のウィンドウがタイムスタンプを作成し、NBBO情報が表示されます:
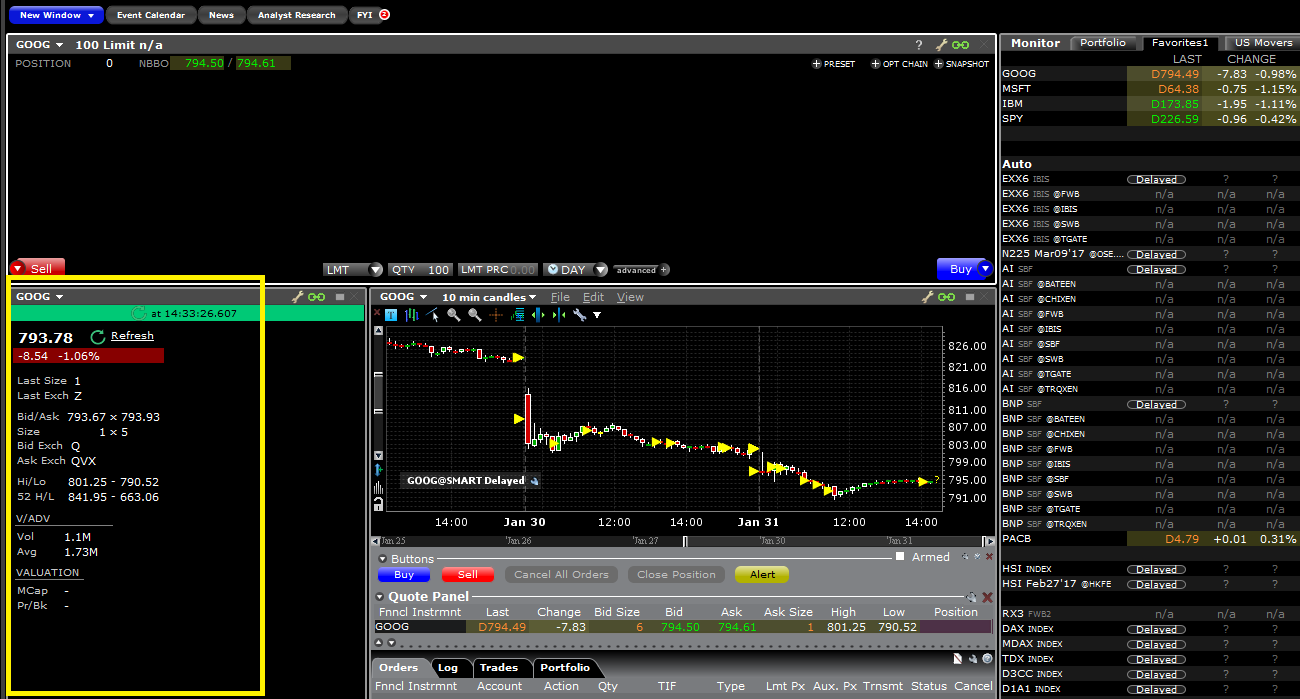
ウィンドウの更新リンクをクリックすると、NBBOクオートがアップデートされます。
クライアント・ポータル:
遅延データが表示されていて、スナップショット許可をお持ちの場合、ビッド/アスク価格の下の注文チケットウィンドウスナップショットのリンクが現れます:
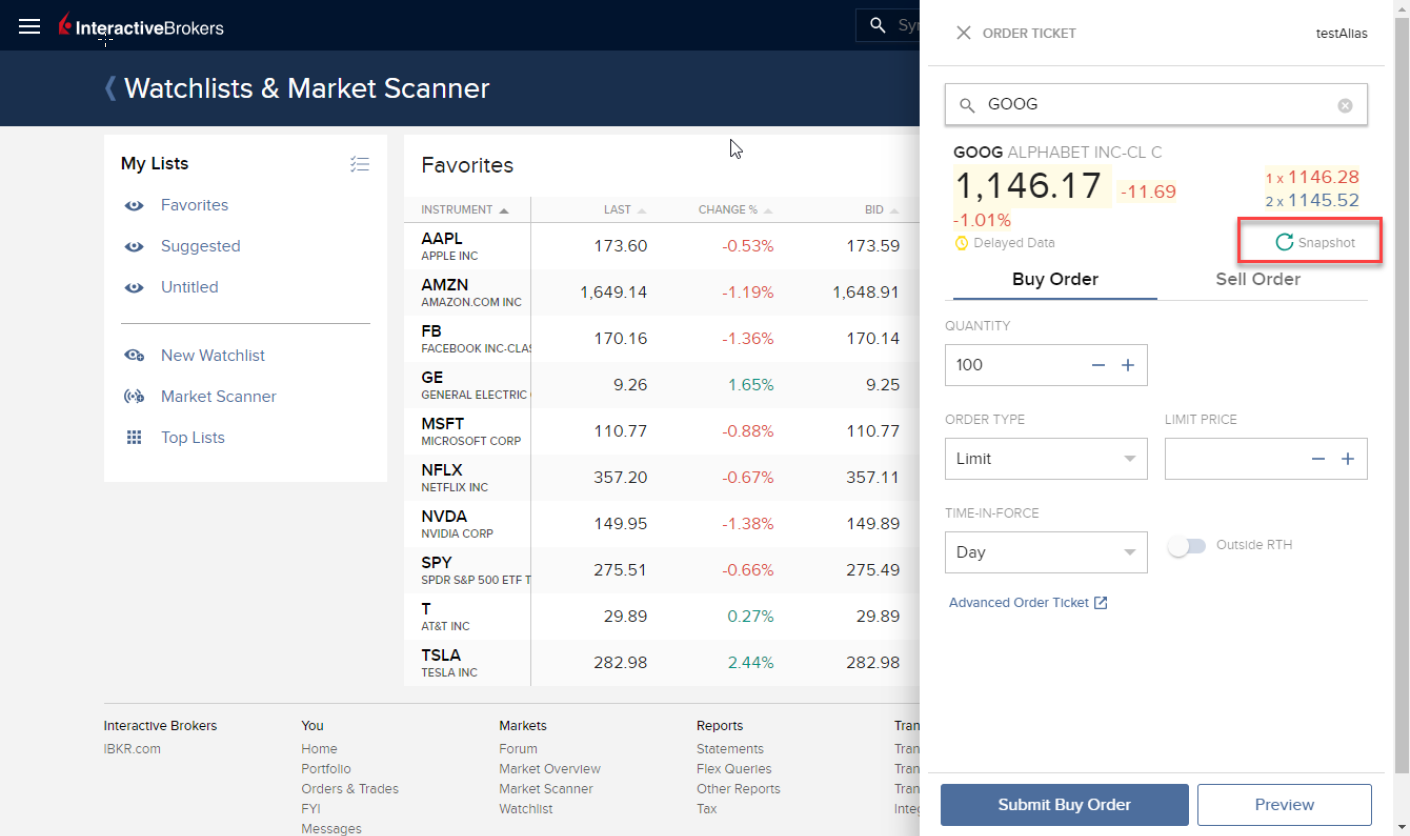
スナップショットボタンをクリックすると、クオート詳細のウィンドウが表示されます。シンボルのNBBOが受信され次第、クオート詳細のウィンドウがタイムスタンプを作成します:
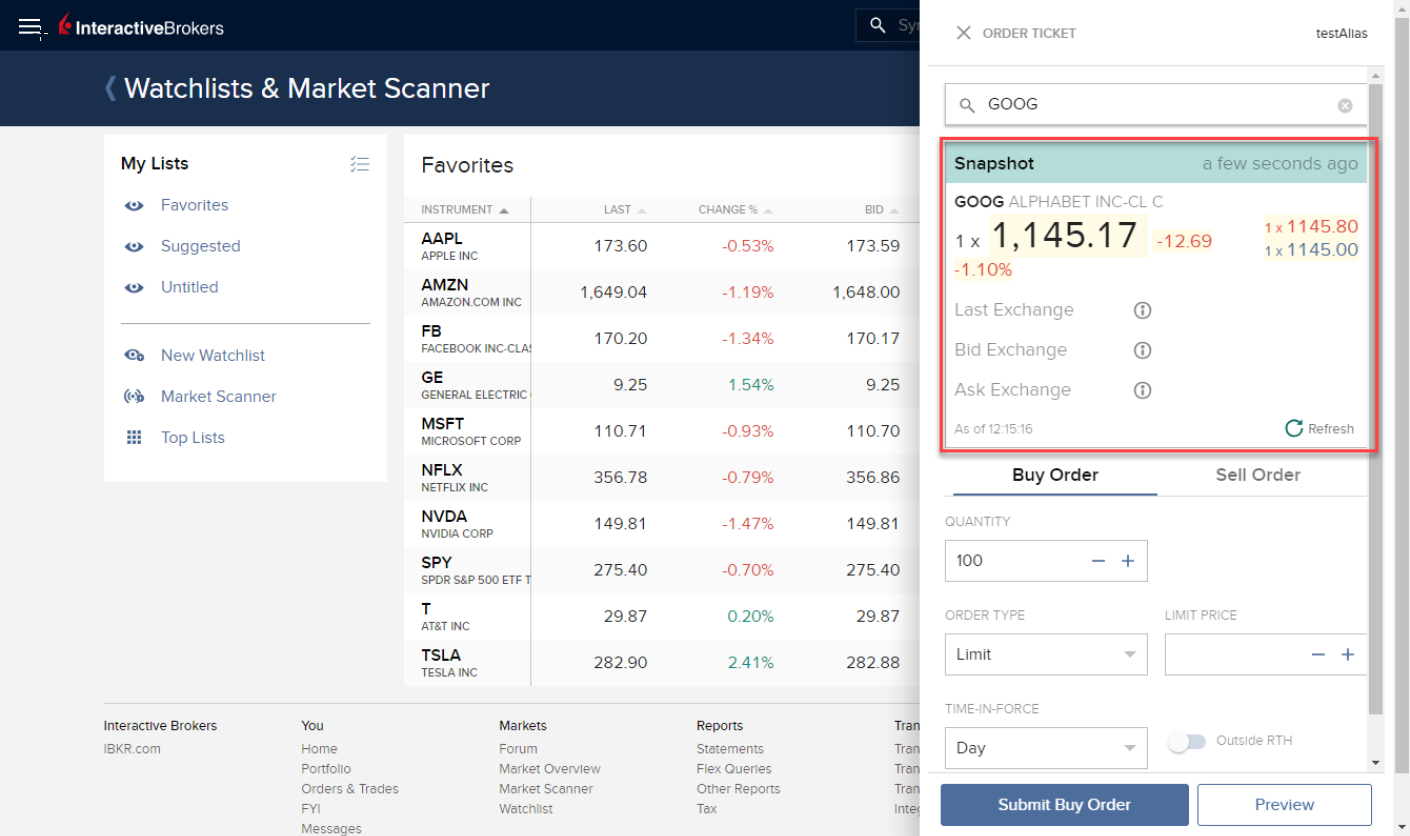
スナップショットのウィンドウの更新リンクをクリックすると、NBBOクオートがアップデートされます。
ウェブ取引 - WebTrader:
遅延データが表示されていて、スナップショット許可をお持ちの場合、追加データのコラムの下のマーケットタブに、スナップショットボタンが現れます:
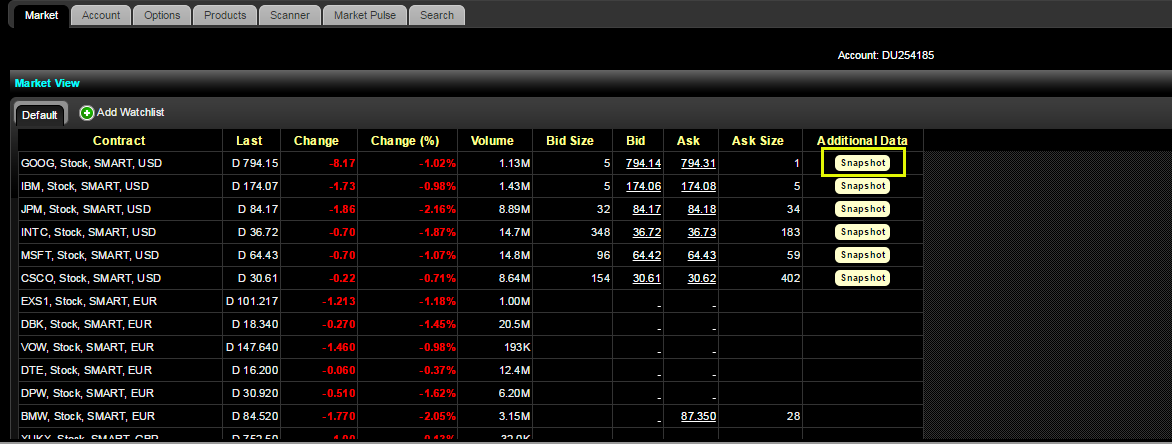
スナップショットボタンをクリックすると、クオート詳細のウィンドウが表示されます。シンボルのNBBOが受信され次第、クオート詳細のウィンドウがタイムスタンプを作成します:
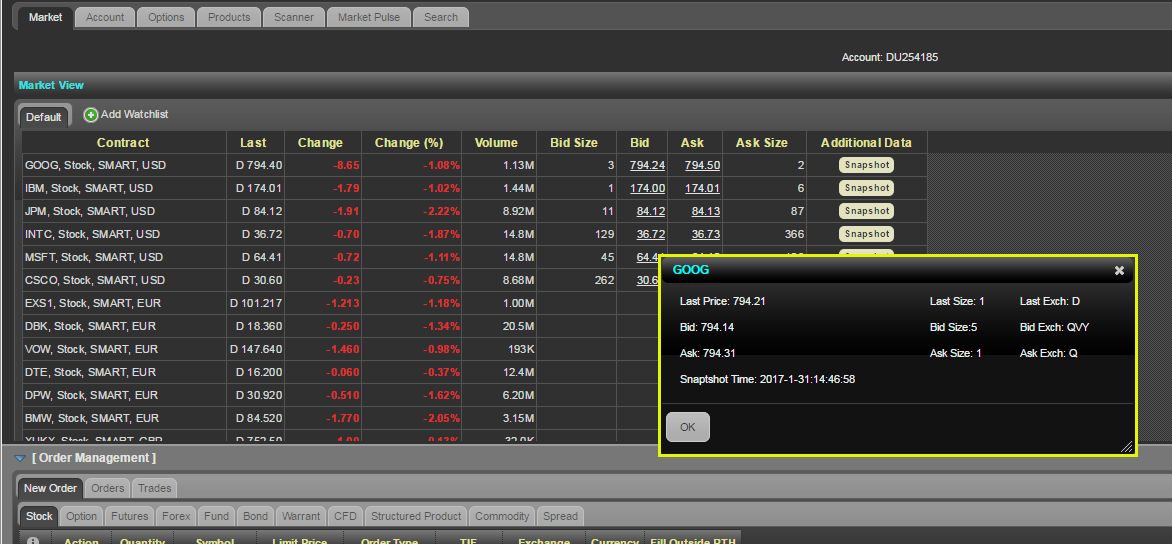
モバイル取引 - IBKRモバイルアプリ:
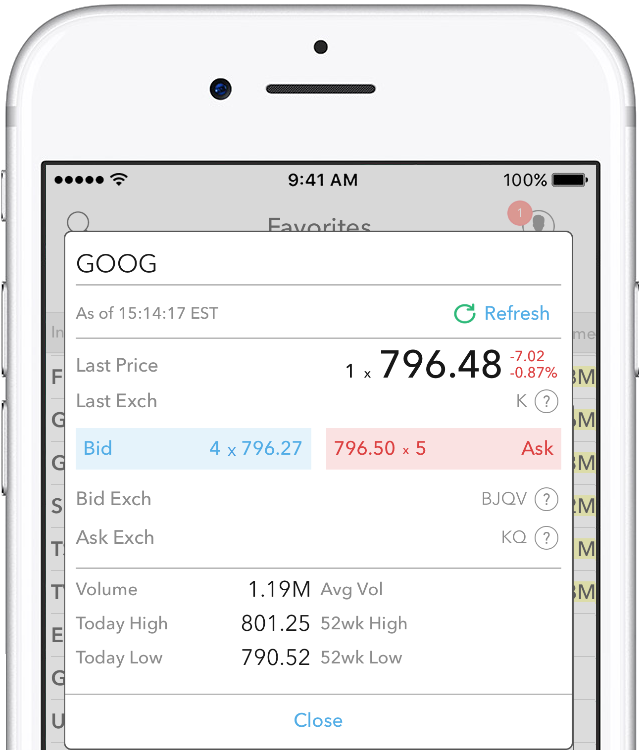
クオート画面でシンボルをタップすると、クオートボックスが拡張します。遅延データが表示されていて、スナップショット許可をお持ちの場合、スナップショットのリンクが現れます:
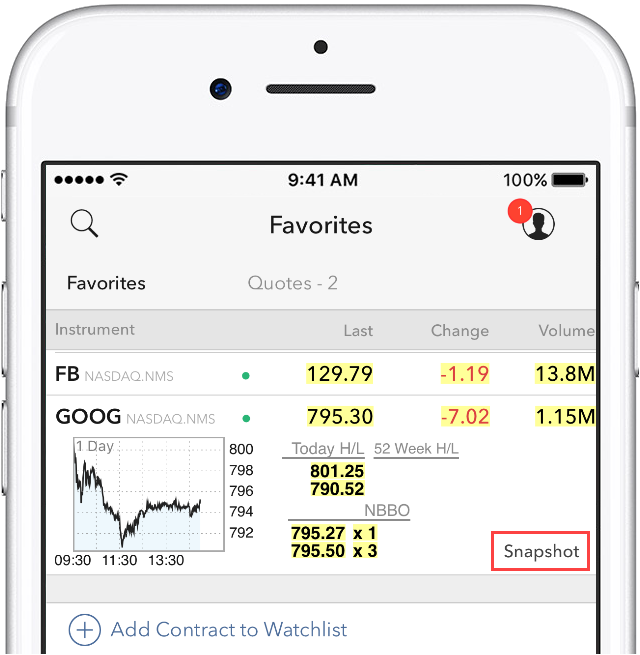
スナップショットリンクをタップすると、クオート詳細のウィンドウが表示されます。シンボルのNBBOが受信され次第、クオート詳細のウィンドウがタイムスタンプを作成し、NBBO情報を含めるクオートの詳細がこのウィンドウに表示されます:
