Alternative Streaming Quotes for European Equities
Alternative Streaming Quotes for EU Equities
On August 1st, 2022, clients with non-professional or non-commercial market data subscriber status will receive complimentary real-time streaming Best Bid and Offer and last sale quotes on European Equities. These quotes will be aggregated from exchanges such as Cboe Europe, Gettex, Tradegate and Turquoise. The data will display in the SMART quote line and can be used to generate a chart as well.
Eligible users will see a no charge service called 'Alternative European Equities (L1)' added to their account on or before August 1, 2022. Please note this will be a default Market Data service that cannot be removed.
Users who would like to receive the full EBBO (European Best Bid and Offer) will need to subscribe to the individual exchange subscriptions.
VR(T) time decay and term adjusted Vega columns in Risk Navigator (SM)
Background
Risk Navigator (SM) has two Adjusted Vega columns that you can add to your report pages via menu Metrics → Position Risk...: "Adjusted Vega" and "Vega x T-1/2". A common question is what is our in-house time function that is used in the Adjusted Vega column and what is the aim of these columns. VR(T) is also generally used in our Stress Test or in the Risk Navigator custom scenario calculation of volatility index options (i.e VIX).
Abstract
Implied volatilities of two different options on the same underlying can change independently of each other. Most of the time the changes will have the same sign but not necessarily the same magnitude. In order to realistically aggregate volatility risk across multiple options into a single number, we need an assumption about relationship between implied volatility changes. In Risk Navigator, we always assume that within a single maturity, all implied volatility changes have the same sign and magnitude (i.e. a parallel shift of volatility curve). Across expiration dates, however, it is empirically known that short term volatility exhibits a higher variability than long term volatility, so the parallel shift is a poor assumption. This document outlines our approach based on volatility returns function (VR(T)). We also describe an alternative method developed to accommodate different requests.
VR(T) time decay
We applied the principal component analysis to study daily percentage changes of volatility as a function of time to maturity. In that study we found that the primary eigen-mode explains approximately 90% of the variance of the system (with second and third components explaining most of the remaining variance being the slope change and twist). The largest amplitude of change for the primary eigenvector occurs at very short maturities, and the amplitude monotonically decreases as time to expiration increase. The following graph shows the main eigenvector as a function of time (measured in calendar days). To smooth the numerically obtained curve, we parameterize it as a piecewise exponential function.
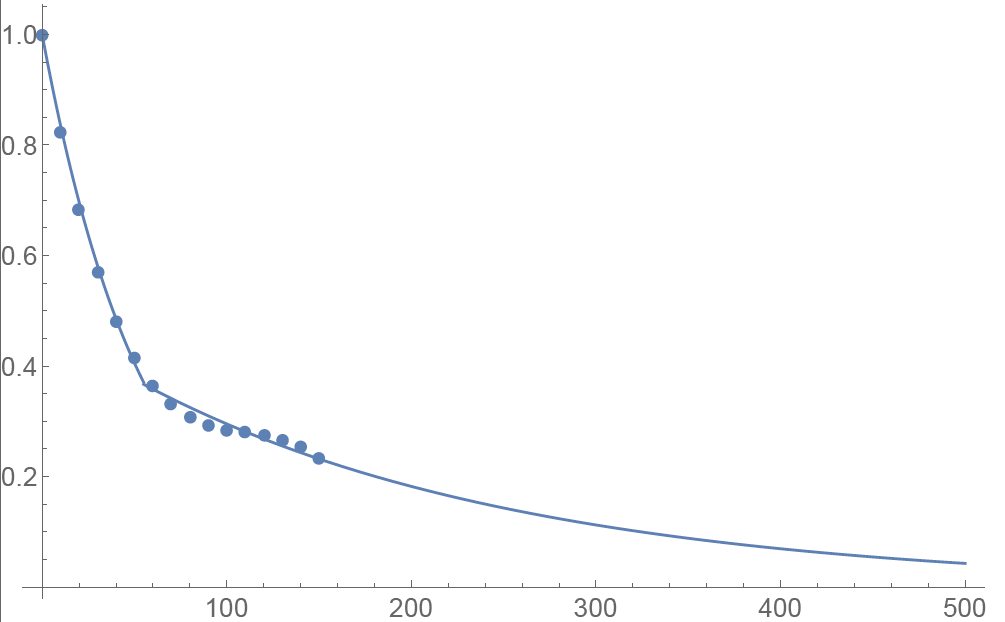
Functional Form: Amplitude vs. Calendar Days
To prevent the parametric function from becoming vanishingly small at long maturities, we apply a floor to the longer term exponential so the final implementation of this function is:
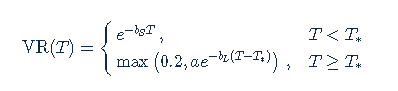
where bS=0.0180611, a=0.365678, bL=0.00482976, and T*=55.7 are obtained by fitting the main eigenvector to the parametric formula.
Inverse square root time decay
Another common approach to standardize volatility moves across maturities uses the factor 1/√T. As shown in the graph below, our house VR(T) function has a bigger volatility changes than this simplified model.
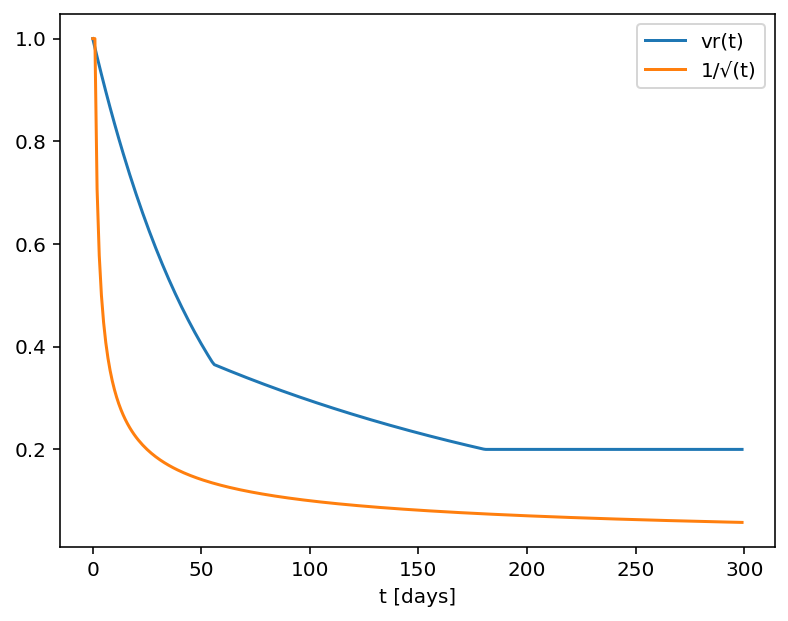
Time function comparison: Amplitude vs. Calendar Days
Adjusted Vega columns
Risk Navigator (SM) reports a computed Vega for each position; by convention, this is the p/l change per 1% increase in the volatility used for pricing. Aggregating these Vega values thus provides the portfolio p/l change for a 1% across-the-board increase in all volatilities – a parallel shift of volatility.
However, as described above a change in market volatilities might not take the form of a parallel shift. Empirically, we observe that the implied volatility of short-dated options tends to fluctuate more than that of longer-dated options. This differing sensitivity is similar to the "beta" parameter of the Capital Asset Pricing Model. We refer to this effect as term structure of volatility response.
By multiplying the Vega of an option position with an expiry-dependent quantity, we can compute a term-adjusted Vega intended to allow more accurate comparison of volatility exposures across expiries. Naturally the hoped-for increase in accuracy can only come about if the adjustment we choose turns out to accurately model the change in market implied volatility.
We offer two parametrized functions of expiry which can be used to compute this Vega adjustment to better represent the volatility sensitivity characteristics of the options as a function of time to maturity. Note that these are also referred as 'time weighted' or 'normalized' Vega.
Adjusted Vega
A column titled "Vega Adjusted" multiplies the Vega by our in-house VR(T) term structure function. This is available any option that is not a derivative of a Volatility Product ETP. Examples are SPX, IBM, VIX but not VXX.
Vega x T-1/2
A column for the same set of products as above titled "Vega x T-1/2" multiplies the Vega by the inverse square root of T (i.e. 1/√T) where T is the number of calendar days to expiry.
Aggregations
Cross over underlying aggregations are calculated in the usual fashion given the new values. Based on the selected Vega aggregation method we support None, Straight Add (SA) and Same Percentage Move (SPM). In SPM mode we summarize individual Vega values multiplied by implied volatility. All aggregation methods convert the values into the base currency of the portfolio.
Custom scenario calculation of volatility index options
Implied Volatility Indices are indexes that are computed real-time basis throughout each trading day just as a regular equity index, but they are measuring volatility and not price. Among the most important ones is CBOE's Marker Volatility Index (VIX). It measures the market's expectation of 30-day volatility implied by S&P 500 Index (SPX) option prices. The calculation estimates expected volatility by averaging the weighted prices of SPX puts and calls over a wide range of strike prices.
The pricing for volatility index options have some differences from the pricing for equity and stock index options. The underlying for such options is the expected, or forward, value of the index at expiration, rather than the current, or "spot" index value. Volatility index option prices should reflect the forward value of the volatility index (which is typically not as volatile as the spot index). Forward prices of option volatility exhibit a "term structure", meaning that the prices of options expiring on different dates may imply different, albeit related, volatility estimates.
For volatility index options like VIX the custom scenario editor of Risk Navigator offers custom adjustment of the VIX spot price and it estimates the scenario forward prices based on the current forward and VR(T) adjusted shock of the scenario adjusted index on the following way.
- Let S0 be the current spot index price, and
- S1 be the adjusted scenario index price.
- If F0 is the current real time forward price for the given option expiry, then
- F1 scenario forward price is F1 = F0 + (S1 - S0) x VR(T), where T is the number of calendar days to expiry.
VOLUME – Calculation of Shares Traded
At first glance, the number of shares executed in a given time period would seem to be a straightforward calculation. The simplest definition of volume is the number of shares traded from one point in time to another point in time. However, several variables affect the calculation.
Market conditions may cause a calculation of volume to differ among data providers. For example, the two plans that manage the US Consolidated equities market have different number of, and definition for, trade reporting codes. In addition, data distributors often include variables such as odd lots, corrections, cash trades, or pre-/post-market trades in the volume calculation.
Numbers can become more visible in light volume or over time. For example, what was volume as of 09:37?
| Time | Symbol | Quantity | Price |
| 9:35 | XYZ | 1000 | 19.90 |
| 9:36 | XYZ | -1000 | 19.90 |
| 9:37 | XYZ | 1000 | 19.80 |
Depending on the distributor, the volume at 09:37 could be:
- 1000 shares if the distributor corrects the volume for corrections
- 2000 shares if the distributor only counts positive numbers
- 3000 shares if the distributor reflects the total of all prints expressed as a positive number
This may be a simplified example, but understanding how a distributor calculates volume will help the volume calculation serve as an indicator of market direction.
Alternative Streaming Quotes for US Equities
Overview:
The SEC Vendor Display Rule requires that brokers give clients access to the NBBO at the point of order entry. In order to provide users with free live streaming market data, we cannot display this free stream when entering an order without the client subscribing to the paid NBBO. Please note, this does not apply to non-IBLLC clients.
Background:
Under the Rule 603(c) of Regulation NMS (Vendor Display Rule), when a broker is providing quotation information to clients that can be used to assess the current market or the quality of trade execution, reliance on non-consolidated market information as the source of that quotation would not be consistent with the Vendor Display Rule.
All clients (IBKR Lite and Pro) have access to streaming real-time US equity quotes from Cboe One and IEX at no charge. Since this data does not include all markets, we cannot show this quote when entering parameters for a US stock quote. Therefore and according to FINRA's enforcement of the SEC rule, IBKR provides IBLLC US clients a free default snapshot service, “US Snapshots VDR Required”. If clients do not sign up for an NBBO US equity data service and they are an IBLLC client, they will have access to free real-time snapshots when making trading decisions on US stocks. Order routing will not change based on what is shown on the screen. If one is subscribed to NBBO quotes or not, by default the trade will still take place with the assistance of the SMART order router designed to provide the best price for the order.
Please see the sample screenshots below from TWS Classic and TWS Mosaic for what occurs when placing an order without the NBBO streaming subscription for US equities.
TWS Classic:
1. Screenshot of quotes showing without order entry line item
2. Screenshot of quote going blank when putting in the order entry line item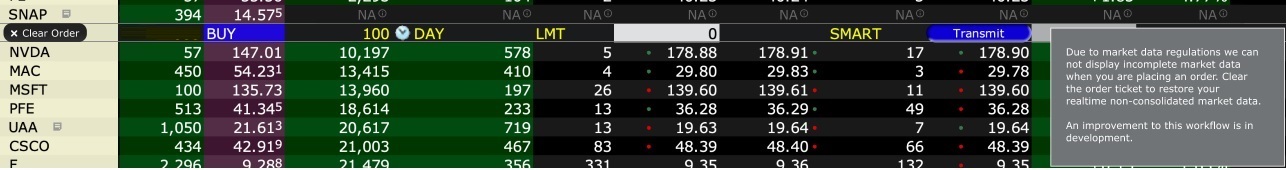
TWS Mosaic:
1. Screenshot of quotes showing without order entry line item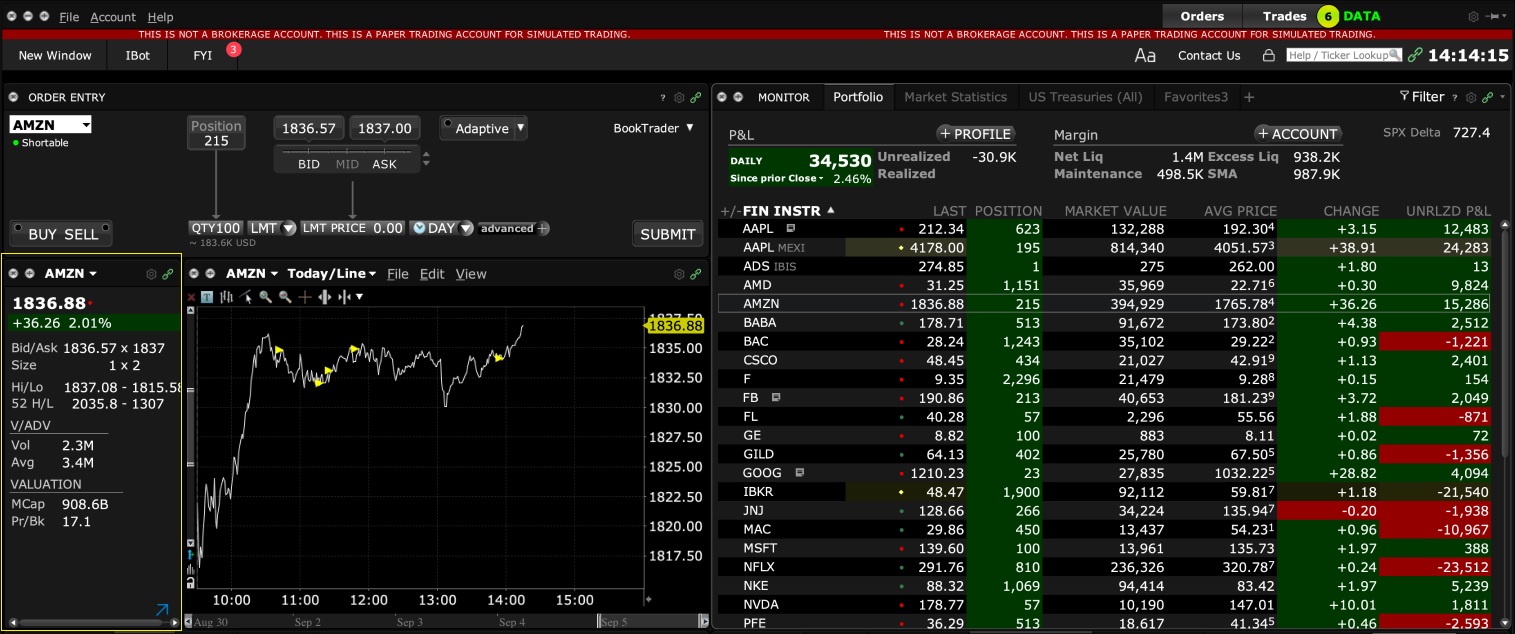
2. Screenshot of quote going blank when putting in the order entry line item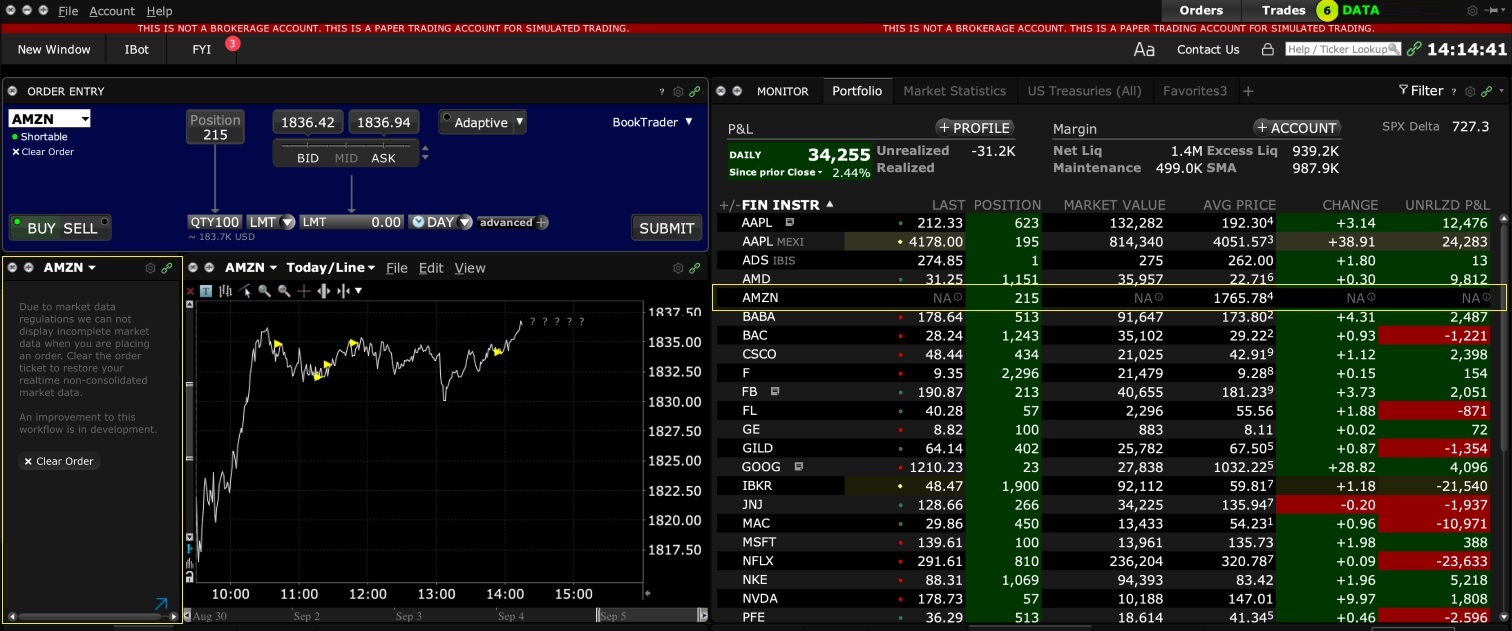
FTSE Indices at IBKR
IBKR does not make available real-time index levels for indices published by the FTSE Group. This is due to the disproportionately high licensing fees FTSE would require of IBKR.
Affected indices are the FTSE 100 and the FTSE MIB 40.
You may instead refer to the “Last” prices for IBKR CFDs IBGB100 and IBIT40 respectively, which are the mid-points of the CFD quotes, and an accurate real-time reflection of traded prices for the futures contracts related to these indices.
Specifically, the Index CFD quotes are based on synthetic indices calculated by back-adjusting the price of the related near-month future for fair value.
In the futures market, fair value is the equilibrium price for a futures contract. It is the price at which an investor effectively pays the appropriate rate of interest, and is compensated for the dividends he forgoes by holding the future rather than the underlying shares. To create the synthetic indices, the fair value adjustment is reversed.
The result is not necessarily exactly the same value as the cash index, in particular because the future may trade above or below its fair value. But as noted above, it is an accurate real-time reflection of the markets related to the index.
While you cannot compare e.g. the IBGB100 directly to the FTSE 100 in TWS (since we do not display the latter), you can observe the relationship between other Index CFDs and cash indices by comparing, for example, the IBUS500 to the S&P 500 index.
Market Data - Minimum Equity Threshold
INTRODUCTION
As a matter of policy, and to minimize the likelihood of a low-balance account falling out of margin compliance and being subject to forced liquidations, IBKR enforces a minimum equity requirement as a prerequisite for subscribing to real-time market data.
This requirement works as follows: Once an account has met the minimum equity requirement necessary to subscribe to data, it is allowed to maintain those subscriptions as long as it has the funds available to pay for those subscriptions and its equity remains above the minimum level. Once equity falls below the minimum level, it will be required to restore equity to at least the minimum level before resuming subscriptions.
While clients are not required to subscribe to real-time quotes through IBKR as a condition of trading, those that do are encouraged to maintain equity well above the maintenance level to avoid any fluctuations that would impair continuity of subscriptions.
Minimum equity thresholds vary by account type and are outlined in the table below.
EQUITY MINIMUMS
Market Data Equity Thresholds1| Account Type |
Minimum2 |
| Individual (unless listed below) | $500 |
| Financial Advisor | $500 |
| Financial Advisor Client Account | $500 |
| Institutional and/or Organizational Account | $500 |
| Family Advisor | $200 |
| Non-Professional Advisor | $200 |
| Introducing Broker Clients | $200 |
| Individual client of IB India | $100 |
1 Denominated in USD, but applied in USD equivalent for accounts with a Base Currency other than USD.
2 Represents amount necessary to qualify for subscription renewal in any month following initiation.
Cryptocurrency Products Market Data
Stocks/ETFs
US
GBTC @ PINK
- Non-Professional
- Level 1: OTC Markets (NP,L1)
- Level 1: US Securities Snapshot and Futures Value Bundle (NP,L1)
- Level 2: OTC Markets (NP,L2)
- Level 2: Global OTC and OTC Markets (NP,L2)
- Professional
- Level 1: OTC Markets (P,L1)
- Level 1: Professional US Securities Snapshot Bundle (P,L1)
- Level 2: OTC Markets (P,L2)
- Level 2: Global OTC and OTC Markets (P,L2)
Non-US
BITCOINXB @ SFB
- Non-Professional
- Level 1: Nordic Equity (NP,L1)
- Level 2: Nordic Equity (NP,L2)
- Professional
- Level 1: Nordic Equity (P,L1)
- Level 2: Nordic Equity (P,L2)
COINETH @ SFB
- Non-Professional
- Level 1: Nordic Equity (NP,L1)
- Level 2: Nordic Equity (NP,L2)
- Professional
- Level 1: Nordic Equity (P,L1)
- Level 2: Nordic Equity (P,L2)
COINETHE @ SFB
- Non-Professional
- Level 1: Nordic Equity (NP,L1)
- Level 2: Nordic Equity (NP,L2)
- Professional
- Level 1: Nordic Equity (P,L1)
- Level 2: Nordic Equity (P,L2)
Indices
BRR/BRTI @ CME
- Non-Professional
- CME Real-Time Non-Professional Level 1
- US Securities Snapshot and Futures Value Bundle (NP,L1)
- Professional
- CME Real-Time Professional Level 2 (There is no CME Pro level 1 product)
NYXBT @ FWB/SWB
- Non-Professional
- FWB: Spot Market Germany (Frankfurt/Xetra)(NP,L1)
- SWB: Stuttgart Boerse incl. Euwax (SWB) (NP,L1)
- Professional
- FWB: Spot Market Germany (Frankfurt/Xetra) (P,L1)
- SWB: Stuttgart Boerse incl. Euwax (SWB) (P,L1)
Futures
BRR @ CME
ETHUSDRR @ CME
- Non-Professional
- Level 1: CME Real-Time Non-Professional Level 1
- Level 1: US Securities Snapshot and Futures Value Bundle (NP,L1)
- Level 2: CME Real-Time Non-Professional Level 2
- Level 2: US Value Bundle PLUS (NP,L2)
- Requires US Securities Snapshot and Futures Value Bundle
- This is only for depth of book
- Professional
- Level 2: CME Real-Time Professional Level 2 (There is no CME Pro level 1 product)
BAKKT @ ICECRYPTO
- Non-Professional
- ICE Futures US (NP)
- Professional
- ICE Futures US (P)
Back to Table of Contents: Bitcoin and Other Cryptocurrency Products @ IBKR
Connecticut Sales and Use Tax
The state of Connecticut imposes a sales and use tax which is applicable to online access to information including all data and access fees.
The tax rate as of 2017 is 1% and is applicable to clients with the state of legal residency of Connecticut or a Connecticut permanent/resident address.
The sales and use tax will be applied to all research and market data subscriptions as well as special connections such as VPN, IB Gateway, Extranet and Dedicated Leased Lines.
The sales and use tax will be passed through to client accounts at the time of the subscription billing. The tax is only applicable if a monthly fee is charged, therefore should an account receive a waiver the sales and use tax will similarly be waived.
Delayed Market Data Timing
Overview:
Market data vendors typically offer exchange data in two categories, real-time and delayed. Real-time market data is disseminated as soon as the information is publicly available. Delayed market data is on a time lag that is usually 10-20 minutes behind real-time quotes.
Some exchanges allow delayed data to be displayed without any market data subscription, free of charge. A list of the exchanges we provide delayed data for at no cost and without formal request (i.e., the delayed data will be displayed upon entry of the product symbol on the trading platform) are outlined in the table below. The table also includes the corresponding real-time subscription, the fees for which are posted on IBKR's public website.
Please Note:
- In accordance with regulatory requirements, IBKR no longer offers delayed quotation information on U.S. equities to Interactive Brokers LLC clients.
- Delayed quotes should be used for indicative purposes and not necessarily for trading. The times mentioned may be subject to further delays without notice.
The Americas
| External Exchange Name | IB Exchange Name | Delay Period | Real Time Subscription |
| CBOT | CBOT | 10 minutes | CBOT Real-Time |
| CBOE Futures Exchange | CFE | 10 minutes | CFE Enhanced |
| Market Data Express (MDX) | CBOE | 10 minutes | CBOE Market Data Express Indices |
| CME | CME | 10 minutes | CME Real-Time |
| COMEX | COMEX | 10 minutes | COMEX Real-Time |
| ICE US | NYBOT | 10 minutes | ICE Futures U.S. (NYBOT) |
| Mexican Derivatives Exchange | MEXDER | 15 minutes | Mexican Derivatives Exchange |
| Mexican Stock Exchange | MEXI | 20 minutes | Mexican Stock Exchange |
| Montreal Exchange | CDE | 15 minutes | Montreal Exchange |
| NYMEX | NYMEX | 10 minutes | NYMEX Real-Time |
| NYSE GIF | NYSE | 15 minutes | NYSE Global Index Feed |
| One Chicago | ONE | 10 minutes | OneChicago |
| OPRA | OPRA | 15 minutes | OPRA Top of Book (L1) (US Option Exchanges) |
| OTC Markets | PINK | 15 minutes | OTC Markets |
| Toronto Stock Exchange | TSE | 15 minutes | Toronto Stock Exchange |
| Venture Exchange | VENTURE | 15 minutes | TSX Venture Exchange |
Europe
| External Exchange Name | IB Exchange Name | Delay Period | Real Time Subscription |
| BATS Europe | BATE/CHIX | 15 minutes | European (BATS/Chi-X) Equities |
| Boerse Stuttgart | SWB | 15 minutes | Stuttgart Boerse incl. Euwax (SWB) |
| Bolsa de Madrid | BM | 15 minutes | Bolsa de Madrid |
| Borsa Italiana | BVME/IDEM | 15 minutes | Borsa Italiana (BVME stock / SEDEX / IDEM deriv) |
| Budapest Stock Exchange | BUX | 15 minutes | Budapest Stock Exchange |
| Eurex | EUREX | 15 minutes | Eurex Real-Time Information |
| Euronext | AEB/SBF/MATIF/BELFOX | 15 minutes | Euronext Cash |
| Euronext | AEB/SBF/MATIF/BELFOX | 15 minutes | Euronext Data Bundle |
| Frankfurt Stock Exchange and XETRA | FWB/IBIS/XETRA | 15 minutes | Spot Market Germany (Frankfurt/Xetra) |
| ICE Futures Europe (Commodities) | IPE | 10 minutes | ICE Futures E.U. - Commodities (IPE) |
| ICE Futures Europe (Financials) | ICEEU | 10 minutes | ICE Futures E.U. – Financials (LIFFE) |
| LSE | LSE | 15 minutes | LSE UK |
| LSEIOB | LSEIOB | 15 minutes | LSE International |
| MEFF | MEFF | 15 minutes | BME (MEFF) |
| NASDAQ OMX Nordic Derivatives | OMS | 15 minutes | Nordic Derivatives |
| Prague Stock Exchange | PRA | 15 minutes | Prague Stock Exchange Cash Market |
| SWISS Exchange | EBS/VIRTX | 15 minutes | SIX Swiss Exchange |
| Tel Aviv Stock Exchange | TASE | 15 minutes | Tel Aviv Stock Exchange |
| Turquoise ECN | TRQXCH/TRQXDE/TRQXEN | 15 minutes | Turquoise ECNs |
| Warsaw Stock Exchange | WSE | 15 minutes | Warsaw Stock Exchange |
Asia
| External Exchange Name | IB Exchange Name | Delay Period | Real Time Subscription |
| Australian Stock Exchange | ASX | 20 minutes | ASX Total |
| Hang Seng Indices | HKFE-IND | 15 minutes | Hang Seng Indexes |
| Hong Kong Futures Exchange | HKFE | 15 minutes | Hong Kong Derivatives (Fut & Opt) |
| Hong Kong Stock Exchange | SEHK | 15 minutes | Hong Kong Securities Exchange (Stocks, Warrants & Bonds) |
| Korea Stock Exchange | KSE | 20 minutes | Korea Stock Exchange |
| National Stock Exchange of India | NSE | 15 minutes | National Stock Exchange of India, Capital Market Segment |
| Osaka Securities Exchange | OSE.JPN | 20 minutes | Osaka Exchange |
| SGX Derivatives | SGX | 10 minutes | Singapore Exchange (SGX) - Derivatives |
| Shanghai Stock Exchange | SEHKNTL | 15 minutes | Shanghai Stock Exchange |
| Shanghai Stock Exchange STAR Market | SEHKSTAR | 15 minutes | Shanghai Stock Exchange |
| Shenzhen Stock Exchange | SEHKSZSE | 15 minutes | Shenzhen Stock Exchange |
| Singapore Stock Exchange | SGX | 10 minutes | Singapore Exchange (SGX) - Stocks |
| Australia Securities Exchange | ASX24 | 10 minutes | ASX24 Commodities and Futures |
| Taiwan Stock Exchange | TWSE | 20 minutes | Taiwan Stock Exchange |
| Tokyo Stock Exchange | TSEJ | 20 minutes | Tokyo Stock Exchange |
Chicago Personal Property Tax
Chicago has a personal property tax which applies to a non-possessory computer lease by a Chicago resident. The Chicago tax authorities have ruled that tax is to be applied in cases where a customer pays for electronic research/use of an interactive site. The passive receipt or streaming of information is not subject to the tax.
Clients whose permanent residential address or principal business address is Chicago will have this tax passed through to their accounts.
The tax rate, as of October 2017, is 9%. The tax will be charged on the research and news feeds a client is subscribed to. Should a research and news feed be eligible to a waiver based upon commissions generated, the tax will not be applied.
As of October 2017, research and news subscriptions which would be subject to the tax would include
Base IBIS Research Platform and the IBIS Research Essentials Subscription Bundle
Cusip
Dow Jones News Service
Dow Jones Real Time News
US Press Release Feed
Reuters Global Newswire
Reuters StreetEvents Calendars
Reuters Fundamentals
Reuters Basic Newfeed
Morningstar Equity, ETF and Credit Reports
Wall Street Horizons
Zacks Equity Research Reports
The above list is provided on a best efforts basis and is subject to change. Clients will be responsible for any pass through tax regardless of any discrepancy from the list provided above.