Option Levels 1-4
What are the levels of Option Trading Permissions?
IBKR introduced two new, lower levels of option trading permissions, Level 1 and 2, in order to be able to offer option trading to those who currently would not qualify for Limited or Full option trading permissions. Limited permissions are now referred to as Level 3, and Full permissions are considered Level 4.
Please note that clients of IB Canada and IB India are not eligible for option level permissions and remain with Limited or Full option trading permissions.
The type of option strategies available to trade will depend on the level of option permissions approved on the account. The various levels are as follows:
|
Level |
Option Strategies Allowed |
|
Level 1 |
Covered calls, i.e. short call vs long equal quantity of underlying, are allowed. |
|
Level 2 |
Covered Options Positions as defined by FINRA Rule 2360 are allowed with the additional restriction that the expiration date of the long option must be on or after the expiration date of the short option in a spread. |
|
Level 3 |
Option strategies that have limited maximum potential loss are allowed. |
|
Level 4 |
All option strategies are allowed. |
For examples of the types of option combinations allowed in each level, please see the following chart:
|
Strategy |
Level Requirement |
|
Covered Call/Covered Basket Call |
Level 1 |
|
Buy Write |
Level 1 |
|
Long option positions |
Level 2 |
|
Long Call |
Level 2 |
|
Long Put |
Level 2 |
|
Covered Put |
Level 2 |
|
Protective Call |
Level 2 |
|
Protective Put |
Level 2 |
|
Long Straddle |
Level 2 |
|
Long Strangle |
Level 2 |
|
Conversion |
Level 2 |
|
Long call spread |
Level 2 |
|
Long put spread |
Level 2 |
|
Long Iron Condor |
Level 2 |
|
Long Box Spread |
Level 2 |
|
Collar |
Level 2 |
|
Short Collar |
Level 2 |
|
Short Put |
Level 3 |
|
Synthetic |
Level 3 |
|
Reversal |
Level 3 |
|
Short Call Spread |
Level 3 |
|
Short Put Spread |
Level 3 |
|
Short Iron Condor |
Level 3 |
|
Long Butterfly |
Level 3 |
|
Unbalanced Butterfly |
Level 3 |
|
Short Butterfly |
Level 3 |
|
Calendar Spread - Debit |
Level 3 |
|
Diagnol Spread - Short leg expires first |
Level 3 |
|
Short Naked Call |
Level 4 |
|
Short Straddle |
Level 4 |
|
Short Strangle |
Level 4 |
|
Short Synthetic |
Level 4 |
|
Calendar Spread - Credit |
Level 4 |
|
Diagnol Spread - Long leg expires first |
Level 4 |
What account type is needed to trade options?
Option trading permissions are available for Margin, Cash and IRA/Retirement accounts.
A Margin account may request any level of option trading permissions (1-4). A Cash or IRA account may only request levels 1-3, and full payment is required for all call and put purchases.
Please Note
- Clients who maintain either a cash or margin type account must maintain net liquidating equity of at least USD 2,000 (or equivalent in other currencies) in order to establish or increase an existing uncovered options position.
How do I request or update my option trading permissions?
To update your trading permissions for options:
1. Log in to Client Portal
2. Select the User menu (head and shoulders icon in the top right corner) followed by Settings
3. Under Account Settings find the Trading section
4. Click on Trading Permissions
5. Locate Options section, select Add/Edit or Request under Options, select the level of permissions you want to request and click on CONTINUE.
6. Review and sign the disclosures and agreements.
7. Click CONTINUE and follow the prompts on screen.
Trading permission requests may take 24-48 hours to be reviewed. Find more information on trading permissions in the Client Portal Users' Guide.
Please Note
- When only Options permissions are available for a country the permissions will include both Stock and Index Options.
- US legal residents are generally excluded from trading securities options outside of the United States due to SEC restrictions. Securities options are defined as any option on an individual stock, US legal stock, or any cash settled broad based index future.
- Certain option contracts require an additional permission for "Complex or Leveraged Exchange Traded Products".
Is it possible for someone under the age of 21 to trade options?
All clients are eligible for Level 1 options trading permissions. However, IBKR requires that clients be at least 21 years of age to be eligible for level 2-4 option trading.
What are the requirements to qualify for option trading permissions?
IBKR offers various levels of trading permissions to applicants meeting minimum age, liquid net worth, investment objectives, product knowledge and prior experience qualifications. This information is gathered in the account application phase or in Client Portal if a trading permissions upgrade is requested following initial account approval.
If you need to update or review your financial information, investment objectives or experience use the button above or follow this procedure:
1. Log into Client Portal
2. Go to the User menu (head and shoulders icon in the top right corner) followed by Settings
3. Under Account Settings find the Account Profile section
4. Click on Financial Profile, rectify your information and confirm.
VR(T) time decay and term adjusted Vega columns in Risk Navigator (SM)
Background
Risk Navigator (SM) has two Adjusted Vega columns that you can add to your report pages via menu Metrics → Position Risk...: "Adjusted Vega" and "Vega x T-1/2". A common question is what is our in-house time function that is used in the Adjusted Vega column and what is the aim of these columns. VR(T) is also generally used in our Stress Test or in the Risk Navigator custom scenario calculation of volatility index options (i.e VIX).
Abstract
Implied volatilities of two different options on the same underlying can change independently of each other. Most of the time the changes will have the same sign but not necessarily the same magnitude. In order to realistically aggregate volatility risk across multiple options into a single number, we need an assumption about relationship between implied volatility changes. In Risk Navigator, we always assume that within a single maturity, all implied volatility changes have the same sign and magnitude (i.e. a parallel shift of volatility curve). Across expiration dates, however, it is empirically known that short term volatility exhibits a higher variability than long term volatility, so the parallel shift is a poor assumption. This document outlines our approach based on volatility returns function (VR(T)). We also describe an alternative method developed to accommodate different requests.
VR(T) time decay
We applied the principal component analysis to study daily percentage changes of volatility as a function of time to maturity. In that study we found that the primary eigen-mode explains approximately 90% of the variance of the system (with second and third components explaining most of the remaining variance being the slope change and twist). The largest amplitude of change for the primary eigenvector occurs at very short maturities, and the amplitude monotonically decreases as time to expiration increase. The following graph shows the main eigenvector as a function of time (measured in calendar days). To smooth the numerically obtained curve, we parameterize it as a piecewise exponential function.
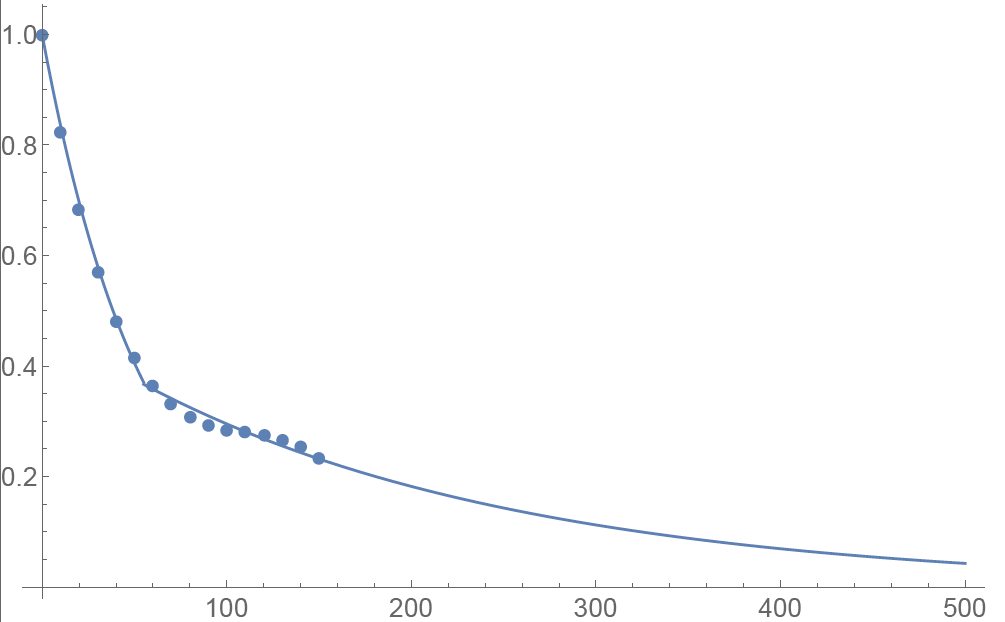
Functional Form: Amplitude vs. Calendar Days
To prevent the parametric function from becoming vanishingly small at long maturities, we apply a floor to the longer term exponential so the final implementation of this function is:
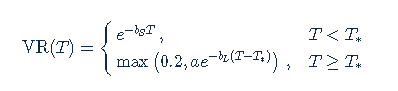
where bS=0.0180611, a=0.365678, bL=0.00482976, and T*=55.7 are obtained by fitting the main eigenvector to the parametric formula.
Inverse square root time decay
Another common approach to standardize volatility moves across maturities uses the factor 1/√T. As shown in the graph below, our house VR(T) function has a bigger volatility changes than this simplified model.
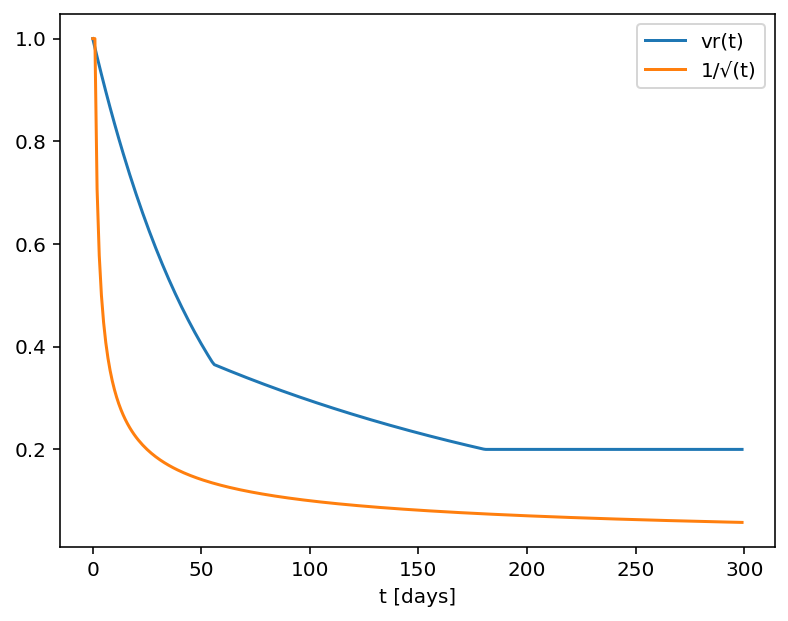
Time function comparison: Amplitude vs. Calendar Days
Adjusted Vega columns
Risk Navigator (SM) reports a computed Vega for each position; by convention, this is the p/l change per 1% increase in the volatility used for pricing. Aggregating these Vega values thus provides the portfolio p/l change for a 1% across-the-board increase in all volatilities – a parallel shift of volatility.
However, as described above a change in market volatilities might not take the form of a parallel shift. Empirically, we observe that the implied volatility of short-dated options tends to fluctuate more than that of longer-dated options. This differing sensitivity is similar to the "beta" parameter of the Capital Asset Pricing Model. We refer to this effect as term structure of volatility response.
By multiplying the Vega of an option position with an expiry-dependent quantity, we can compute a term-adjusted Vega intended to allow more accurate comparison of volatility exposures across expiries. Naturally the hoped-for increase in accuracy can only come about if the adjustment we choose turns out to accurately model the change in market implied volatility.
We offer two parametrized functions of expiry which can be used to compute this Vega adjustment to better represent the volatility sensitivity characteristics of the options as a function of time to maturity. Note that these are also referred as 'time weighted' or 'normalized' Vega.
Adjusted Vega
A column titled "Vega Adjusted" multiplies the Vega by our in-house VR(T) term structure function. This is available any option that is not a derivative of a Volatility Product ETP. Examples are SPX, IBM, VIX but not VXX.
Vega x T-1/2
A column for the same set of products as above titled "Vega x T-1/2" multiplies the Vega by the inverse square root of T (i.e. 1/√T) where T is the number of calendar days to expiry.
Aggregations
Cross over underlying aggregations are calculated in the usual fashion given the new values. Based on the selected Vega aggregation method we support None, Straight Add (SA) and Same Percentage Move (SPM). In SPM mode we summarize individual Vega values multiplied by implied volatility. All aggregation methods convert the values into the base currency of the portfolio.
Custom scenario calculation of volatility index options
Implied Volatility Indices are indexes that are computed real-time basis throughout each trading day just as a regular equity index, but they are measuring volatility and not price. Among the most important ones is CBOE's Marker Volatility Index (VIX). It measures the market's expectation of 30-day volatility implied by S&P 500 Index (SPX) option prices. The calculation estimates expected volatility by averaging the weighted prices of SPX puts and calls over a wide range of strike prices.
The pricing for volatility index options have some differences from the pricing for equity and stock index options. The underlying for such options is the expected, or forward, value of the index at expiration, rather than the current, or "spot" index value. Volatility index option prices should reflect the forward value of the volatility index (which is typically not as volatile as the spot index). Forward prices of option volatility exhibit a "term structure", meaning that the prices of options expiring on different dates may imply different, albeit related, volatility estimates.
For volatility index options like VIX the custom scenario editor of Risk Navigator offers custom adjustment of the VIX spot price and it estimates the scenario forward prices based on the current forward and VR(T) adjusted shock of the scenario adjusted index on the following way.
- Let S0 be the current spot index price, and
- S1 be the adjusted scenario index price.
- If F0 is the current real time forward price for the given option expiry, then
- F1 scenario forward price is F1 = F0 + (S1 - S0) x VR(T), where T is the number of calendar days to expiry.
Complex Position Size
For complex, multi-leg options positions comprising two or more legs, TWS might not track all changes to this position, e.g. a vertical spread where the short leg is assigned and the user re-writes the same leg the next day, or if the user creates a the position over multiple trades, or if the order is not filled as a native combination at the exchange.
If you received a message because you are submitting an order to close a position, roll a position, or modify a position using the “% Change” feature, it means that the maximum quantity of option positions in your account that are available to close for this order is different from that of the original position tracked by TWS.
Before submitting, you should review the order and confirm that the order quantity we have calculated is the correct quantity that you want to trade.
Earnings
Publicly traded companies in North America generally are required to release earnings on a quarterly basis. These announcements, which contain a host of relevant statistics, including revenue and margin data, and often projections about the company's future profitability, have the potential to cause a significant move in the market price of the company's shares. From an options trading viewpoint, anything with the potential to cause volatility in a stock affects the pricing of its options. Earnings releases are no exceptions.
Options traders often try to anticipate the market's reaction to earnings news. They know implied volatilities, the key to options prices, will steadily rise while skew - the difference in implied volatility between at-money and out-of-the-money options - will steadily steepen as the earnings date approaches. The degree by which those adjustments occur is often based on history. Stocks that have historically made significant post-earnings moves often have more expensive options.
Earnings risk is idiosyncratic, meaning that it is usually stock specific and not easily hedged against an index or a similar company. Stocks that are normally quite well correlated may react quite differently, leading to share prices that diverge or indices with dampened moves. For those reasons, there is no single strategy that works for trading options in these situations. Traders must have very clear expectations for a stock's potential move, and then decide which combination of options will likely lead to the most profitable results if the trader is correct.
If the market seems too sanguine about a company's earnings prospects, it is fairly simple (though often costly) to buy a straddle or an out-of the-money put and hope for a big move. Taking advantage of the opposite prospect, when front month implied volatilities seem too high, can also be profitable but it can also cause serious losses to be short naked options in the face of a big upward stock move. Traders can take advantage of high front month volatility by buying a calendar spread - selling a front month put and buying the same strike in the following month. The maximum profit potential is reached if the stock trades at the strike price, with the front-month option decaying far faster than the more expensive longer-term option. Losses are limited to the initial trade price.
Sometimes excessive fear is expressed by extremely steep skew, when out-of-the-money puts display increasingly higher implied volatilities than at-money options. Traders who use vertical spreads can capitalize on this phenomenon. Those who are bearish can buy an at-money put while selling an out-of-the-money put. This allows the purchaser to defray some of the cost of a high priced option, though it caps the trade's profits if the stock declines below the lower strike. On the other hand, those who believe the market is excessively bearish can sell an out-of-the-money put while buying an even lower strike put. Although the trader is buying the higher volatility option, it allows him to make money as long as the stock stays above the higher strike price, while capping his loss at the difference between the two strikes.
This article is provided for information only and is not intended as a recommendation or a solicitation to buy or sell securities. Option trading can involve significant risk. Before trading options read the "Characteristics and Risks of Standardized Options." Customers are solely responsible for their own trading decisions.
Considerations for Exercising Call Options Prior to Expiration
INTRODUCTION
Exercising an equity call option prior to expiration ordinarily provides no economic benefit as:
- It results in a forfeiture of any remaining option time value;
- Requires a greater commitment of capital for the payment or financing of the stock delivery; and
- May expose the option holder to greater risk of loss on the stock relative to the option premium.
Nonetheless, for account holders who have the capacity to meet an increased capital or borrowing requirement and potentially greater downside market risk, it can be economically beneficial to request early exercise of an American Style call option in order to capture an upcoming dividend.
BACKGROUND
As background, the owner of a call option is not entitled to receive a dividend on the underlying stock as this dividend only accrues to the holders of stock as of its dividend Record Date. All other things being equal, the price of the stock should decline by an amount equal to the dividend on the Ex-Dividend date. While option pricing theory suggests that the call price will reflect the discounted value of expected dividends paid throughout its duration, it may decline as well on the Ex-Dividend date. The conditions which make this scenario most likely and the early exercise decision favorable are as follows:
1. The option is deep-in-the-money and has a delta of 100;
2. The option has little or no time value;
3. The dividend is relatively high and its Ex-Date precedes the option expiration date.
EXAMPLES
To illustrate the impact of these conditions upon the early exercise decision, consider an account maintaining a long cash balance of $9,000 and a long call position in hypothetical stock “ABC” having a strike price of $90.00 and time to expiration of 10 days. ABC, currently trading at $100.00, has declared a dividend of $2.00 per share with tomorrow being the Ex-Dividend date. Also assume that the option price and stock price behave similarly and decline by the dividend amount on the Ex-Date.
Here, we will review the exercise decision with the intent of maintaining the 100 share delta position and maximizing total equity using two option price assumptions, one in which the option is selling at parity and another above parity.
SCENARIO 1: Option Price At Parity - $10.00
In the case of an option trading at parity, early exercise will serve to maintain the position delta and avoid the loss of value in long option when the stock trades ex-dividend, to preserve equity. Here the cash proceeds are applied in their entirety to buy the stock at the strike, the option premium is forfeited and the stock (net of dividend) and dividend receivable are credited to the account. If you aim for the same end result by selling the option prior to the Ex-Dividend date and purchasing the stock, remember to factor in commissions/spreads:
| SCENARIO 1 | ||||
|
Account Components |
Beginning Balance |
Early Exercise |
No Action |
Sell Option & Buy Stock |
| Cash | $9,000 | $0 | $9,000 | $0 |
| Option | $1,000 | $0 | $800 | $0 |
| Stock | $0 | $9,800 | $0 | $9,800 |
| Dividend Receivable | $0 | $200 | $0 | $200 |
| Total Equity | $10,000 | $10,000 | $9,800 | $10,000 less commissions/spreads |
SCENARIO 2: Option Price Above Parity - $11.00
In the case of an option trading above parity, early exercise to capture the dividend may not be economically beneficial. In this scenario, early exercise would result in a loss of $100 in option time value, while selling the option and buying the stock, after commissions, may be less beneficial than taking no action. In this scenario, the preferable action would be No Action.
| SCENARIO 2 | ||||
|
Account Components |
Beginning Balance |
Early Exercise |
No Action |
Sell Option & Buy Stock |
| Cash | $9,000 | $0 | $9,000 | $100 |
| Option | $1,100 | $0 | $1,100 | $0 |
| Stock | $0 | $9,800 | $0 | $9,800 |
| Dividend Receivable | $0 | $200 | $0 | $200 |
| Total Equity | $10,100 | $10,000 | $10,100 | $10,100 less commissions/spreads |
![]() NOTE:
NOTE:
Options have two components that make up their total premium value - intrinsic value and time value. The intrinsic value is the amount by which the option is in-the-money, while the time value represents the possibility that the option could become even more profitable before expiration as the underlying asset price fluctuates while providing protection against adverse moves.
Many options are American-style, which means they can be exercised early, ahead of their expiration date. Early exercise of an option eliminates the remaining time value component from the option's premium, since the option holder loses protection against unfavorable movements in the underlying asset’s price.
This makes early exercise suboptimal in most situations, as the option holder is willingly forfeiting a portion of the option's value.
There are a few specific circumstances where early exercise could make sense, such as:
- For call options on a stock that will pay dividends soon, where the dividend amount exceeds the remaining time value (and only if the exercise will settle on or prior to the record date for the dividend).
- For deep in-the-money options where the time value is negligible compared to the intrinsic value, and the option is expected to drop in value due to interest rate effects (PUTS), or expected stock loan benefits (CALLS).
The first case, exercising an in the money call immediately ahead of a dividend payment, is the most common economically-sensible early exercise. In most cases, it is advisable to hold or sell the option instead of exercising it early, in order to capture the remaining time value. An option should only be exercised early after carefully considering all factors and determining that the benefits of early exercise outweigh the time value being surrendered.
Account holders holding a long call position as part of a spread should pay particular attention to the risks of not exercising the long leg given the likelihood of being assigned on the short leg. Note that the assignment of a short call results in a short stock position and holders of short stock positions as of a dividend Record Date are obligated to pay the dividend to the lender of the shares. In addition, the clearinghouse processing cycle for exercise notices does not accommodate submission of exercise notices in response to assignment.
As example, consider a credit call (bear) spread on the SPDR S&P 500 ETF Trust (SPY) consisting of 100 short contracts in the March '13 $146 strike and 100 long contracts in the March '13 $147 strike. On 3/14/13, with the SPY Trust declared a dividend of $0.69372 per share, payable 4/30/13 to shareholders of record as of 3/19/13. Given the 3 business day settlement time frame for U.S. stocks, one would have had to buy the stock or exercise the call no later than 3/14/13 in order receive the dividend, as the next day the stock began trading Ex-Dividend.
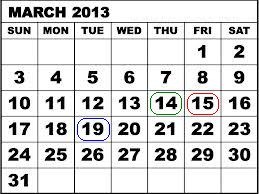
On 3/14/13, with one trading day left prior to expiration, the two option contracts traded at parity, suggesting maximum risk of $100 per contract or $10,000 on the 100 contract position. However, the failure to exercise the long contract in order to capture the dividend and protect against the likely assignment on the short contracts by others seeking the dividend created an additional risk of $67.372 per contract or $6,737.20 on the position representing the dividend obligation were all short calls assigned. As reflected on the table below, had the short option leg not been assigned, the maximum risk when the final contract settlement prices were determined on 3/15/13 would have remained at $100 per contract.
| Date | SPY Close | March '13 $146 Call | March '13 $147 Call |
| March 14, 2013 | $156.73 | $10.73 | $9.83 |
| March 15, 2013 | $155.83 | $9.73 | $8.83 |
Please note that if your account is subject to tax withholding requirements of the US Treasure rule 871(m), it may be beneficial to close a long option position before the ex-dividend date and re-open the position after ex-dividend.
For information regarding how to submit an early exercise notice please click here.
The above article is provided for information purposes only as is not intended as a recommendation, trading advice nor does it constitute a conclusion that early exercise will be successful or appropriate for all customers or trades. Account holders should consult with a tax specialist to determine what, if any, tax consequences may result from early exercise and should pay particular attention to the potential risks of substituting a long option position with a long stock position.
Equity & Index Option Position Limits
Overview:
Equity option exchanges define position limits for designated equity options classes. These limits define position quantity limitations in terms of the equivalent number of underlying shares (described below) which cannot be exceeded at any time on either the bullish or bearish side of the market. Account positions in excess of defined position limits may be subject to trade restriction or liquidation at any time without prior notification.
Background:
Position limits are defined on regulatory websites and may change periodically. Some contracts also have near-term limit requirements (near-term position limits are applied to the side of the market for those contracts that are in the closest expiring month issued). Traders are responsible for monitoring their positions as well as the defined limit quantities to ensure compliance. The following information defines how position limits are calculated;
Option position limits are determined as follows:
- Bullish market direction -- long call & short put positions are aggregated and quantified in terms of equivalent shares of stock.
- Bearish market direction -- long put & short call positions are aggregated and quantified in terms of equivalent shares of stock.
The following examples, using the 25,000 option contract limit, illustrate the operation of position limits:
- Customer A, who is long 25,000 XYZ calls, may at the same time be short 25,000 XYZ calls, since long and short positions in the same class of options (i.e., in calls only or in puts only) are on opposite sides of the market and are not aggregated
- Customer B, who is long 25,000 XYZ calls, may at the same time be long 25,000 XYZ puts. Rule 4.11 does not require the aggregation of long call and long put (or short call and short put) positions, since they are on opposite sides of the market.
- Customer C, who is long 20,000 XYZ calls, may not at the same time be short more than 5,000 XYZ puts, since the 25,000 contract limit applies to the aggregate position of long calls and short puts in options covering the same underlying security. Similarly, if Customer C is also short 20,000 XYZ calls, he may not at the same time have a long position of more than 5,000 XYZ puts, since the 25,000 contract limit applies separately to the aggregation of short call and long put positions in options covering the same underlying security.
Notifications and restrictions:
IB will send notifications to customers regarding the option position limits at the following times:
- When a client exceeds 85% of the allowed limit IB will send a notification indicating this threshold has been exceeded
- When a client exceeds 95% of the allowed limit IB will place the account in closing only. This state will be maintained until the account falls below 85% of the allowed limit. New orders placed that would increase the position will be rejected.
Notes:
Position limits are set on the long and short side of the market separately (and not netted out).
Traders can use an underlying stock position as a "hedge" if they are over the limit on the long or short side (index options are reviewed on a case by case basis for purposes of determining which securities constitute a hedge).
Position information is aggregated across related accounts and accounts under common control.
Definition of related accounts:
IB considers related accounts to be any account in which an individual may be viewed as having influence over trading decisions. This includes, but is not limited to, aggregating an advisor sub-account with the advisor's account (and accounts under common control), joint accounts with individual accounts for the joint parties and organization accounts (where an individual is listed as an officer or trader) with other accounts for that individual.
Position limit exceptions:
Regulations permit clients to exceed a position limit if the positions under common control are hedged positions as specified by the relevant exchange. In general the hedges permitted by the US regulators that are recognized in the IB system include outright stock position hedges, conversions, reverse conversions and box spreads. Currently collar and reverse collar strategies are not supported hedges in the IB system. For more detail about the permissible hedge exemptions refer to the rules of the self regulatory organization for the relevant product.
OCC posts position limits defined by the option exchanges. They can be found here.
http://www.optionsclearing.com/webapps/position-limits
How to create option spread strategies using Stategy Builder
How to create option spread strategies using OptionTrader
Where can I receive additional information on options?
The Options Clearing Corporation (OCC), the central clearinghouse for all US exchange traded securities option, operates a call center to serve the educational needs of individual investors and retail securities brokers. The resource will address the following questions and issues related to OCC cleared options products:
- Options Industry Council information regarding seminars, video and educational materials;
- Basic options-related questions such as definition of terms and product information;
- Responses to strategic and operational questions including specific trade positions and strategies.
The call center can be reached by dialing 1-800-OPTIONS. The hours of operation are Monday through Thursday from 8 a.m. to 5 p.m. (CST) and Friday from 8 a.m. to 4 p.m. (CST). Hours for the monthly expiration Friday will be extended to 5 p.m. (CST).
What is the margin on a Butterfly option strategy?
Overview:
In order for the software utilized by IB to recognize a position as a Butterfly, it must match the definition of a Butterfly exactly. These are the 3 different types of Butterfly spreads recognized by IBKR, and the margin calculation on each:
Background:
Long Butterfly:
Two short options of the same series (class, multiplier, strike price, expiration) offset by one long option of the same type (put or call) with a higher strike price, and one long option of the same type with a lower strike price. All component options must have the same expiration, same underlying, and intervals between exercise prices must be equal.
There is no margin requirement on this position. The long option cost is subtracted from cash and the short option proceeds are applied to cash.
Short Butterfly Put:
Two long put options of the same series offset by one short put option with a higher strike price and one short put option with a lower strike price. All component options must have the same expiration, same underlying, and intervals between exercise prices must be equal.
The margin requirement for this position is (Aggregate put option highest exercise price - aggregate put option second highest exercise price). Long put cost is subtracted from cash and short put proceeds are applied to cash.
Short Butterfly Call:
Two long call options of the same series offset by one short call option with a higher strike price and one short call option with a lower strike price. All component options must have the same expiration, same underlying, and intervals between exercise prices must be equal.
The margin requirement for this position is (Aggregate call option second lowest exercise price - aggregate call option lowest exercise price). Long option cost is subtracted from cash and short option proceeds are applied to cash.
*Please note that Interactive Brokers utilizes option margin optimization software to try to create the minimum margin requirement. However, due to the system requirements required to determine the optimal solution, we cannot always guarantee the optimal combination in all cases. Other option positions in the account could cause the software to create a strategy you didn't originally intend, and therefore would be subject to a different margin equation.