IB TWSとIB KeyのIBKRモバイルへの統合
概要
ユーザーの移行は現在ご利用のアプリの状況によって異なります。以下をご確認ください:
1. スマートフォンを取引のみに使用(IB TWSをインストール済み) - こちらをクリック
2. スマートフォンを認証のみに使用(IB Keyをインストール済み) - こちらをクリック
3. スマートフォンを取引と認証の両方に使用(IB TWSとIB Keyをインストール済み) - こちらをクリック
4. スマートフォンをデビットカードでの取引に使用(IB Keyをインストール済み) - こちらをクリック
IB TWSをご利用のユーザ―の場合
ご利用のスマートフォンのIB TWSから、IB Keyを使わずにお取引をされていた場合は以下のようになります。
1. 初めてアプリを立ち上げる際に、以下のホーム画面が新しく表示されます。
図1はiOSデバイス用IBKRモバイルのホーム画面です。図2はアンドロイドデバイス用のホーム画面です。
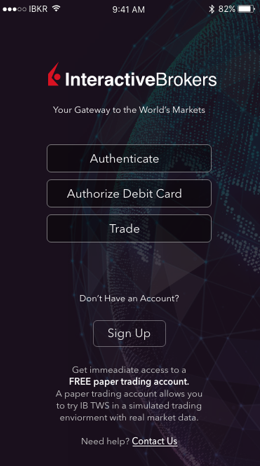
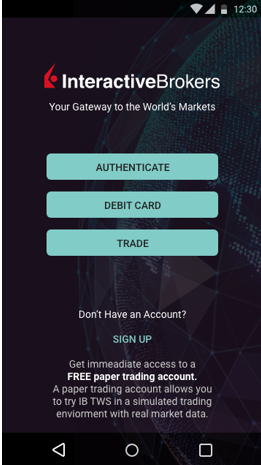
図1 図2
2. 取引ボタンをタップしてください。
3. これ以降はすべて今までと同じです。
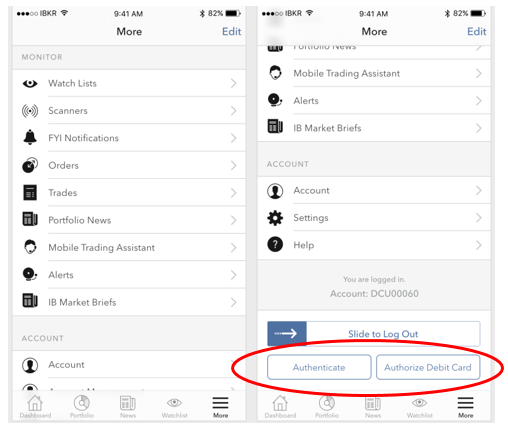
取引画面から他の機能にアクセスする
認証モジュールやデビットカード機能など、IBKRモバイルの別の機能へのアクセスを
ご希望の場合:
iOSの場合(図3)
1. 「さらに表示」メニュー(画面の右下の端にあります)を開いてください。
2. ページの一番下までスクロールしてください。
アンドロイドの場合(図4)
1. アプリのメニューを開いてください。
2. 下にある「アプリの設定」項目までスクロールしてください。
.png)
図3 図4
IB Keyをご利用のユーザーの場合
有効化
1. IBKRモバイルを立ち上げて、認証をタップしてください。
2. アプリがIB Keyがインストールされたことを検出し、それ以降のアクションを表示します。
アップデートの自動移行(図5)をしてからの自動移行になるか、
後にマニュアルでの移行のどちらかになります。
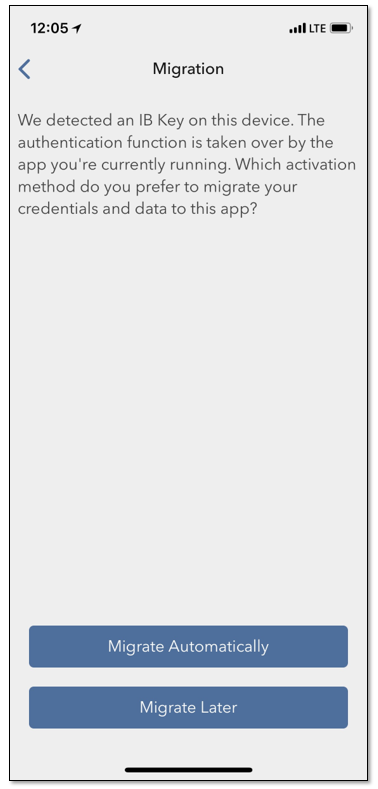
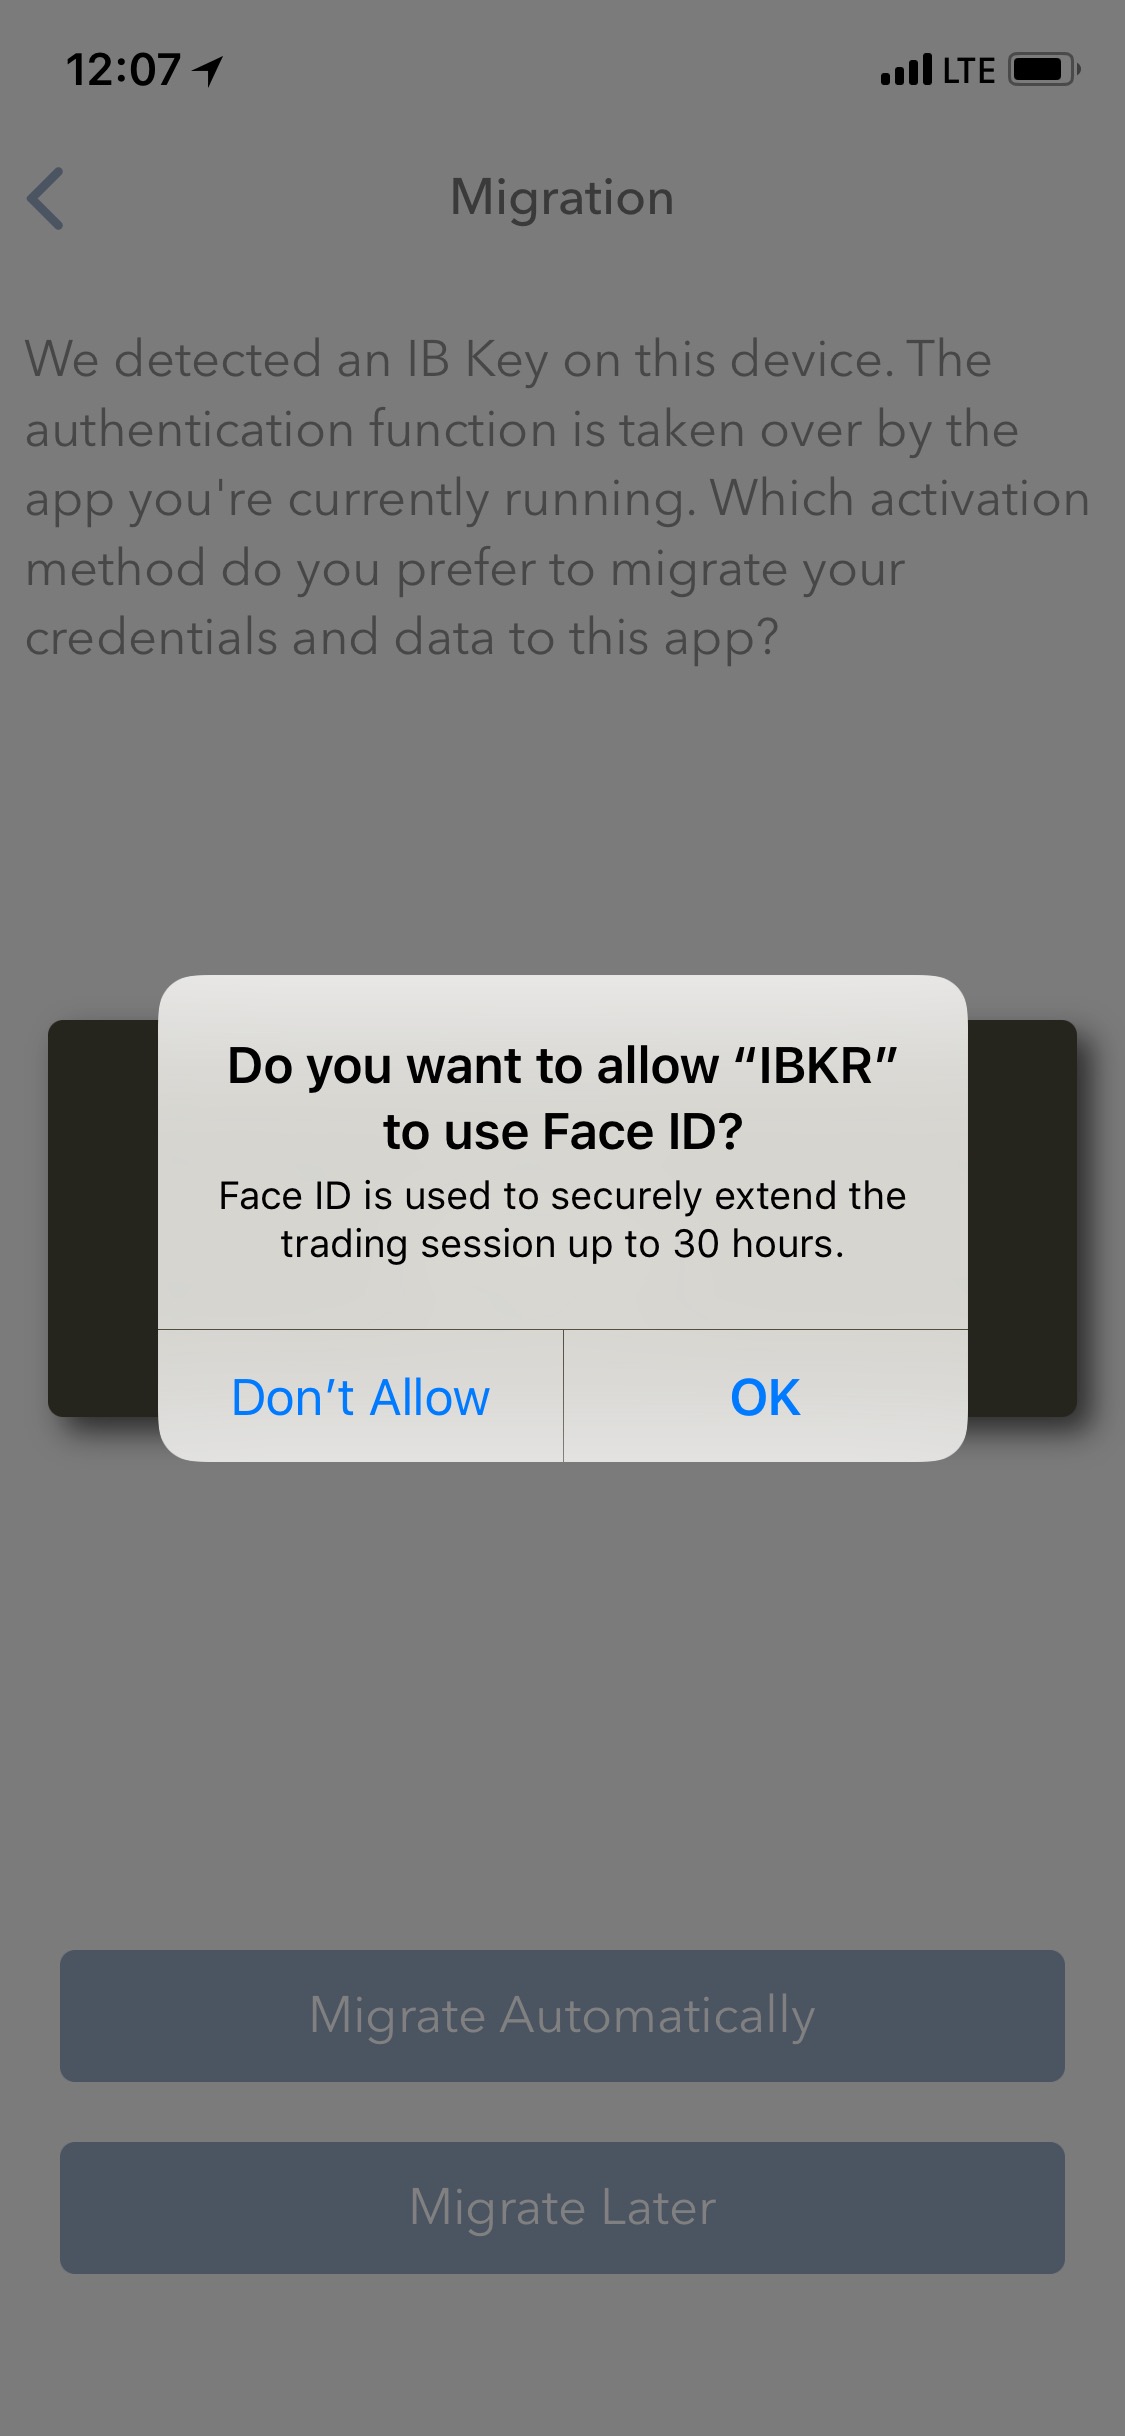
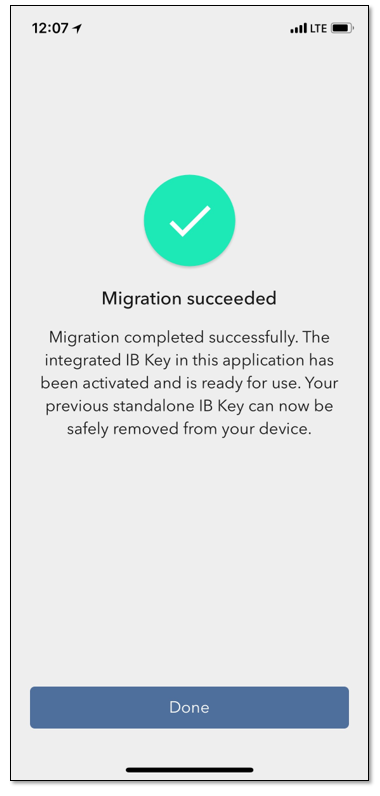
図5 図6 図7
移行の完了後にスタンドアローンのIB Keyアプリ(過去にお客様が認証されたもの)起動すると、
次の画面(図8)が表示されます
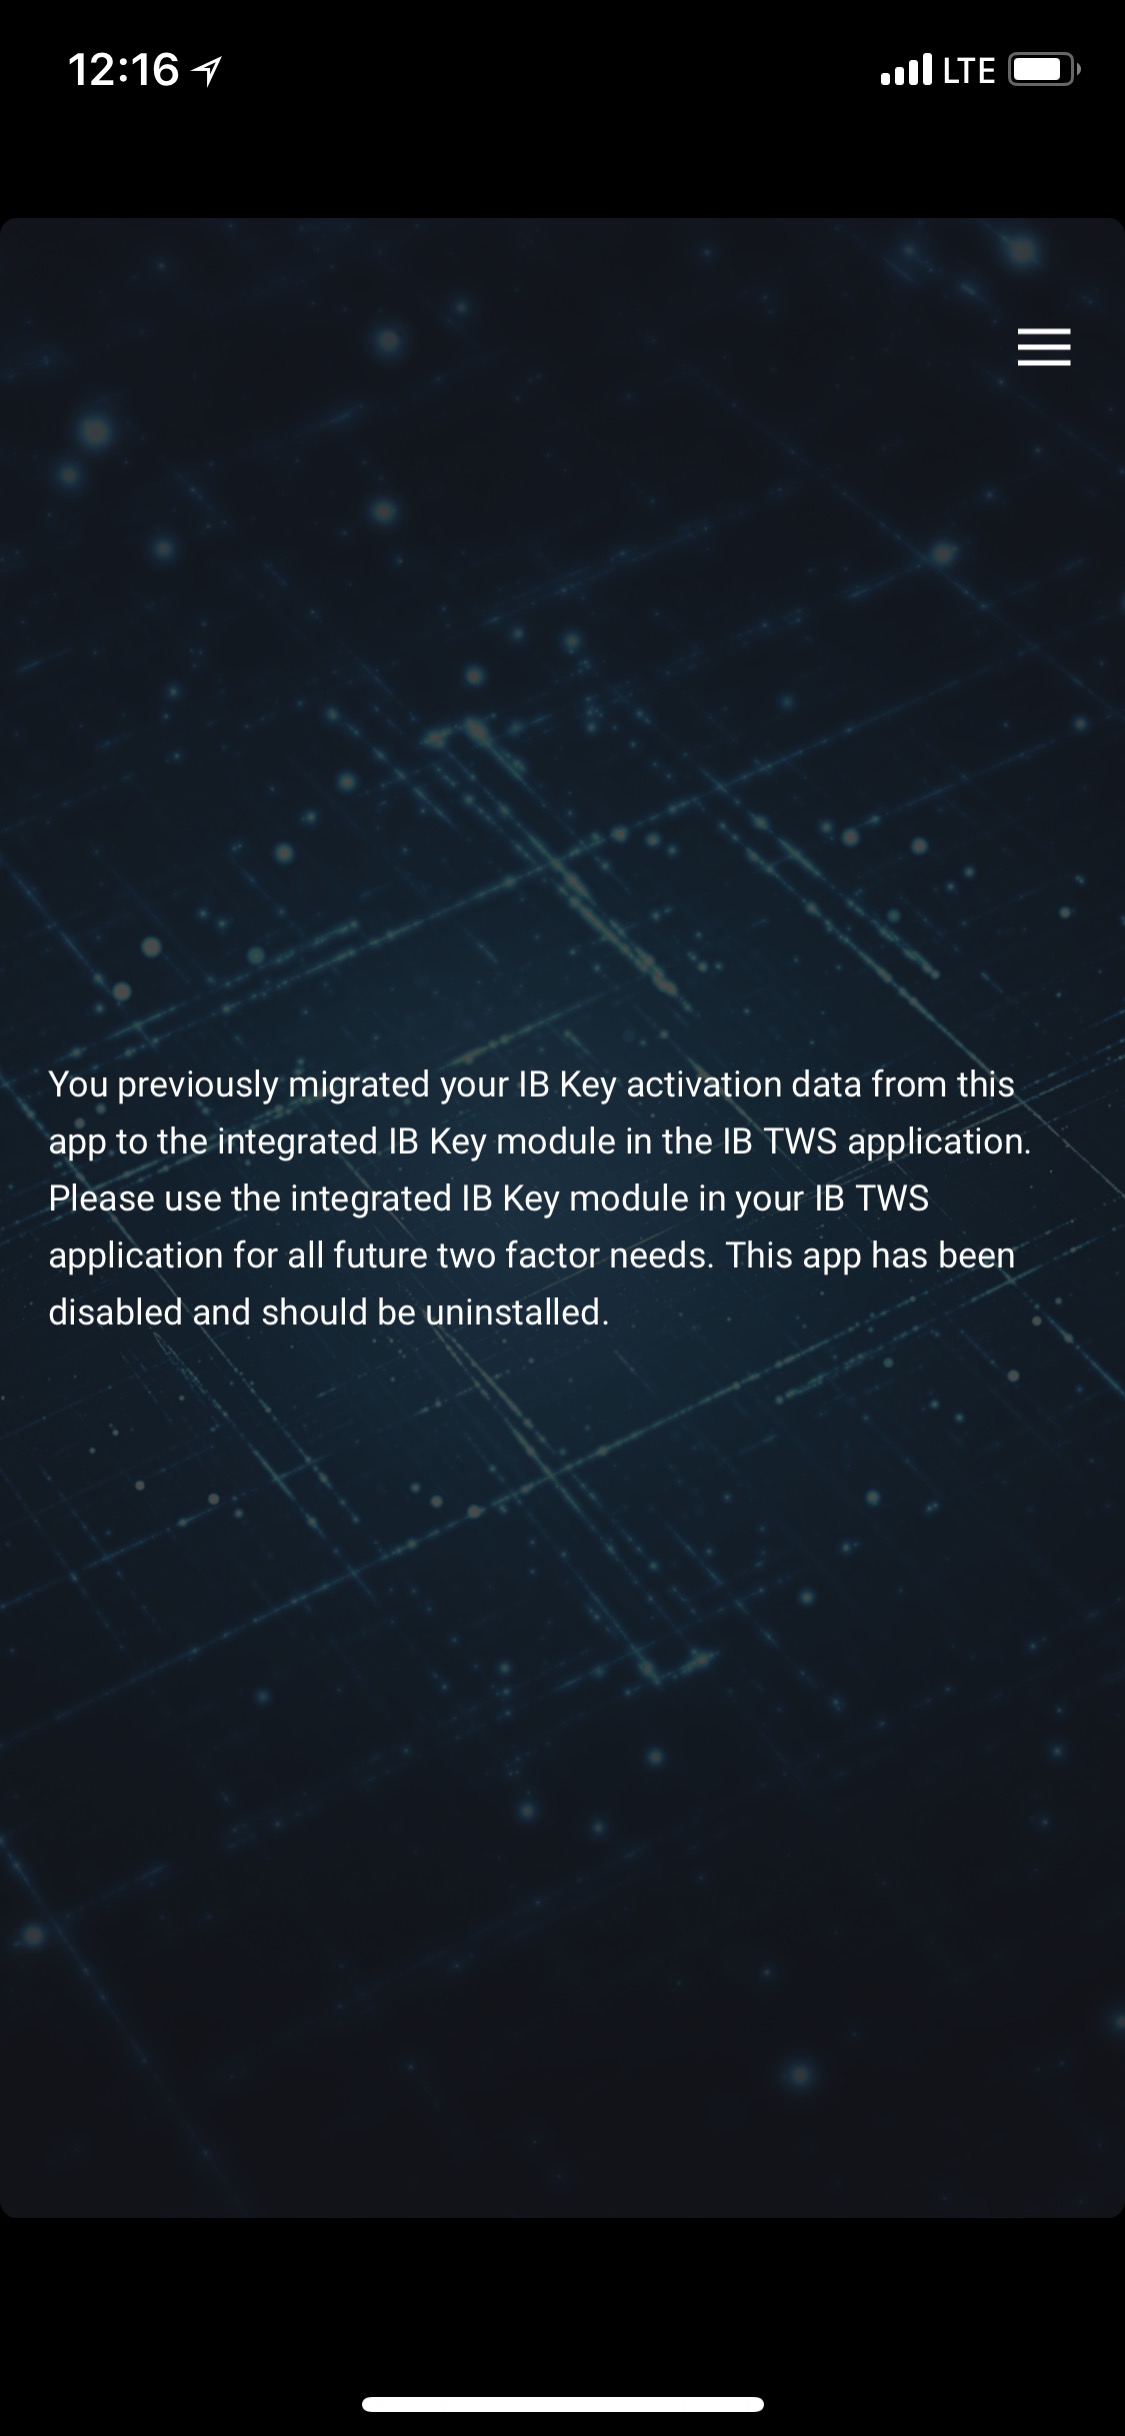
図8
毎日のオペレーション
A. ログインの際、インターネット接続がある場合には特に変更はなく、シームレス
認証プロセスが使用されます:
1. TWSやアカウント・マネジメント、WebTraderやIBKRモバイルの該当する欄にログイン情報を
入力してください。ログインをクリックしてください。
2. システムからお客様のスマートフォンの画面に通知が送信されますので、これをタップしてください。
3. ご利用のデバイスにより、カメラを使用しての顔認識やセンサー(iOS)による指紋認証を行うか、
PINコード(アンドロイドの場合)を入力してください。システムが自動的に進んでいきます。
B. インターネット接続がない場合には、IBKRモバイルのチャレンジ-レスポンス・モードをご利用ください:
1. TWSやアカウント・マネジメント、WebTraderやIBKRモバイルの該当する欄にログイン情報を
入力してください。「ログイン」をクリックしてください。
2. 「通知を受信していません」というリンクをクリックしてください。
3. IBKRモバイルを立ち上げて「認証」をタップしてください。
4. スマートフォンアプリのチャレンジ欄に、ログイン画面に表示される数字を入力して
ください。「作成」ボタンをタップしてください。
5. スマートフォンアプリに表示される数字をログイン画面のレスポンス欄に入力して
ください。「ログイン」をクリックしてください。
IB TWSとIB Keyの両方をご利用の場合
1. IBKR認証モジュールの有効化手順をまず完了させてください。
モバイルアプリ(こちらをクリック)。
2. IBKRのホーム画面にある取引ボタンをタップして、取引画面にログインしてください。
モバイルアプリ(こちらをクリック)。
IBデビットカードをご利用の場合
1. IBKR認証モジュールの有効化手順をまず完了させてください。
モバイルアプリ(こちらをクリック)。
2. IBKRモバイルアプリのホーム画面にあるデビットカードのボタンをタップしてください。これ以降はすべて
今までと同じです。
Why is my chart delayed, showing question marks or only partially populated?
Background:
What are SMART Charts and how are they generated?
The SMART charting mechanism analyzes and compares the market data coming from all venues a given contract is traded on and graphically displays the most favorable quotes.
When all the data streams are live, the data points are available for all sources and for each time point, thus they can be fully compared. The resulting SMART chart will be up to date and fully populated, moreover it will constantly and automatically update1.
The comparison between non synchronized market data streams (some live and some delayed) is just partially possible, since the delayed feeds are lacking data points for the last 15 or 20 minutes. Therefore, within that time frame, the SMART chart will usually display a series of yellow question marks to indicate unavailability of source data. In this case the SMART Chart will not update automatically.
When the lack of data points is more extensive or when the Exchange does not distribute delayed data for a given contract, the correspondent SMART Chart may be completely blank.
What should I do to obtain a fully populated, up-to-date chart?
If your trading method is based on SMART charts, you would need to activate the live market data subscriptions for all the marketplaces your financial instruments are traded on2. For additional details, please see KB1201
If your trading method does not require SMART charts, you can decide to use Direct chart routing as a workaround.
A Directed Chart will allow you to graphically represent the market data coming from a single, specific Exchange. When possible, we suggest to select the primary marketplace for the product for this purpose, since this is usually the one offering the highest liquidity and trade volume, hence normally providing the most favorable quotes. If you have subscribed the market data for that venue, the resulting Directed Chart will be fully populated, up to date and it will update automatically1.
How do I set up a Directed Chart?
1. Within a watchlist, type the contract symbol and press Enter on your keyboard.
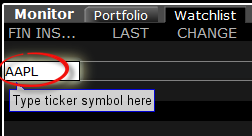
2. When then contract selection menu appears, select the item Stock (Directed). If you do not see this item, click on the small down arrow at the bottom of the menu to reveal the hidden menu items.
.png)
3. The Exchange selection screen will appear. You can now select the main Exchange for the product or the Exchange for which you have an active live market data subscription. Once done, click OK.
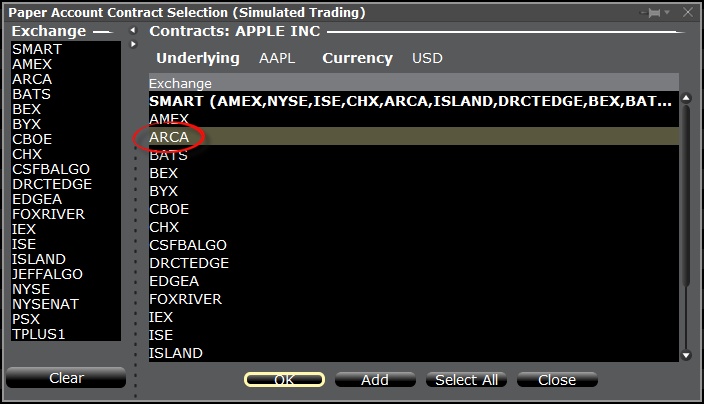
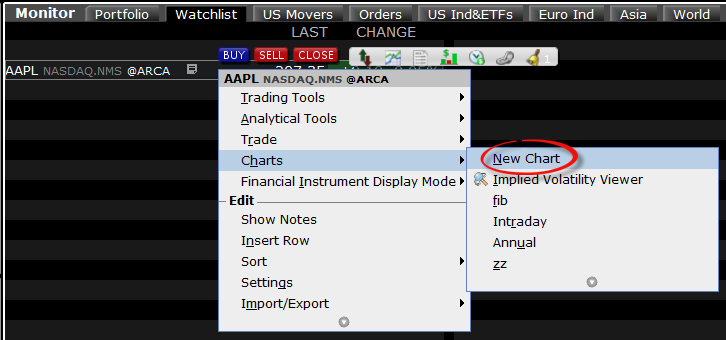
4. Within your watchlist you will see a newly created Directed Ticker line. It will contain the contract symbol and, preceded by the @ sign, the Exchange you selected at the previous step. Right click on that directed ticker line and select Chart > New Chart
5. The chart will be shown. On the left side of the toolbar, after the contract symbol, you will see the Exchange you selected preceeded by a @ sign, indicating that this is a Directed Chart.
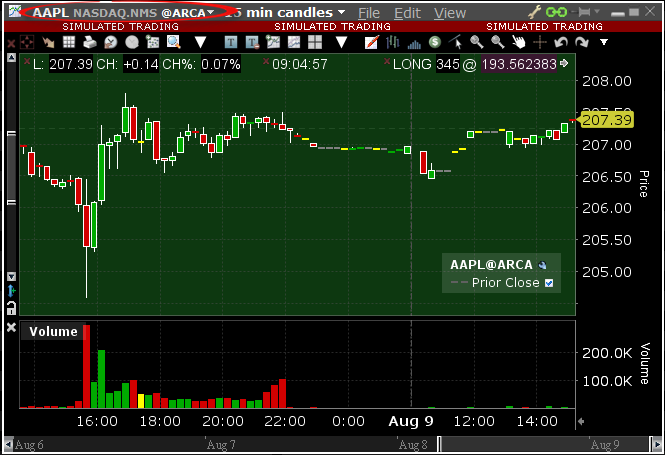
1. In order for the chart to update automatically, the checkbox "Keep chart up to date" has to be activated in the Chart Parameters panel. The panel is reachable directly within the chart window, from the top menu Edit.
2. Alternative streaming quotes for EU equities are available to clients with non-professional or non-commercial market data subscriber status. The complimentary real-time streaming Best Bid and Offer and last sale quotes on European Equities will be aggregated from exchanges such as Cboe Europe, Gettex, Tradegate and Turquoise. The data will display in the SMART quote line and can be used to generate a chart as well. Users who would like to receive the full EBBO (European Best Bid and Offer) will need to subscribe to the individual exchange subscriptions.
エクスポージャーフィー計算レポート
イントロダクション
アカウント・マネジメント(口座管理画面)では、ひとつの画面でお客様の口座を設定また管理することができ、エクスポージャーフィー計算レポートもご覧いただくことができます。エクスポージャーフィーの計算は日々行われ、米国の株式市場が開始する前にアカウント・マネジメント内で公開されます。このレポートでは、お客様の各ポジションの価格が所定のパーセンテージで下落および上昇した場合のポジションの損益(PnL)の変化を確認することができます。
レポートアクセス
エクスポージャーフィー計算レポートアクセス/作成
1)アカウント・マネジメントのホームページより、レポートをクリックし、その他のレポートメニューを選択してください。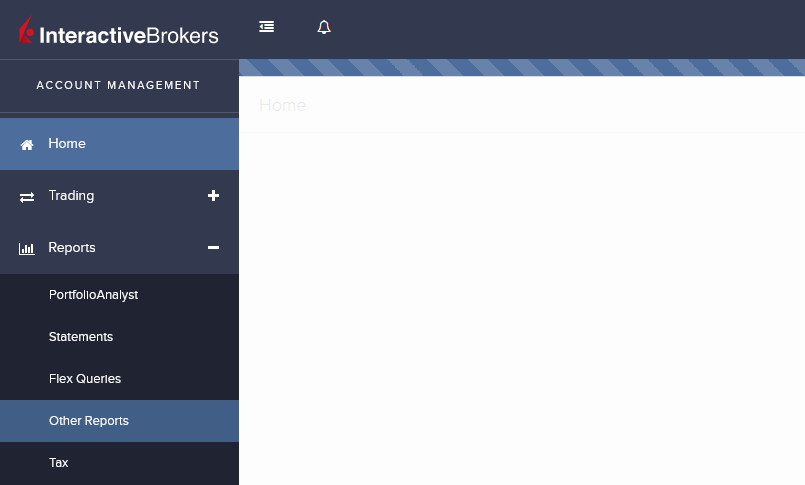
2)次の画面が表示されます。
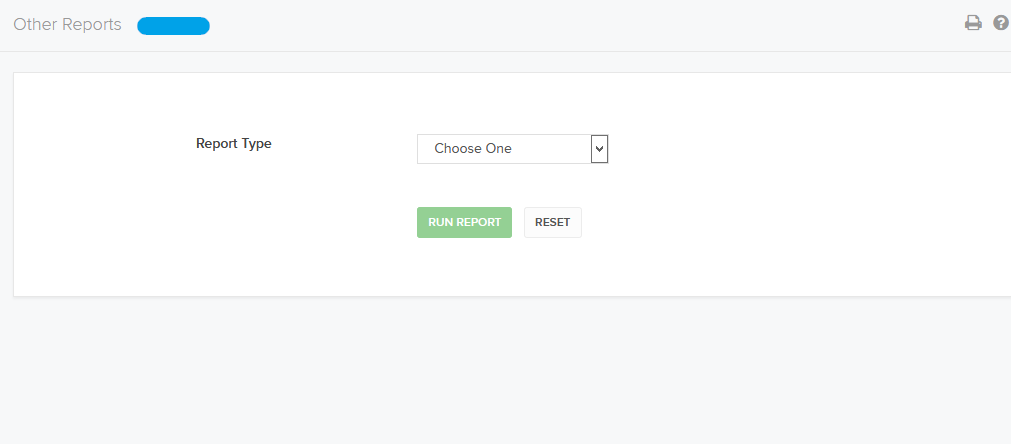
3)レポートタイプのドロップダウンより、エクスポージャーフィー計算を選択します。エクスポージャーフィー計算の設定が表示されます。
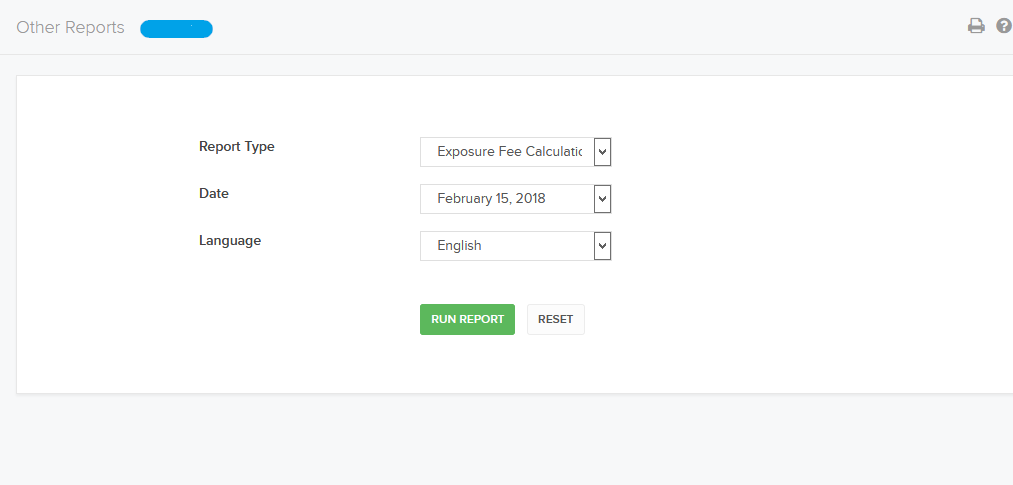
4)レポート用のデータをデータ欄に選択します。
5) レポート作成をクリックしてください。
レポート概要
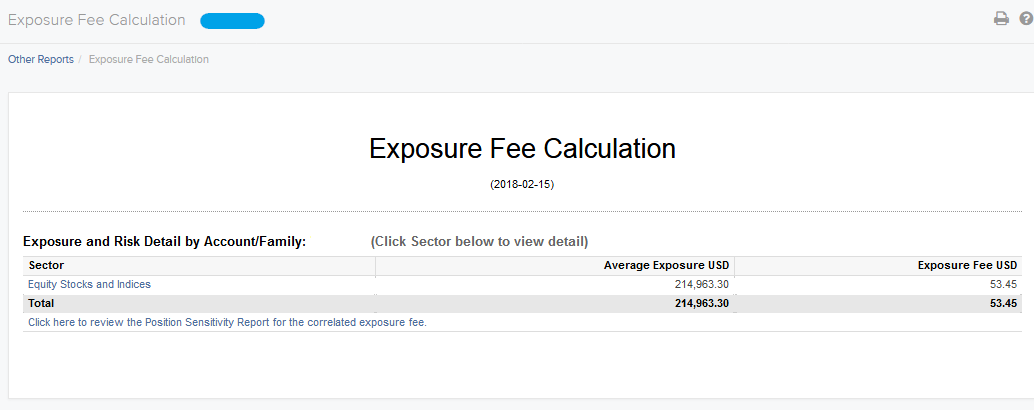
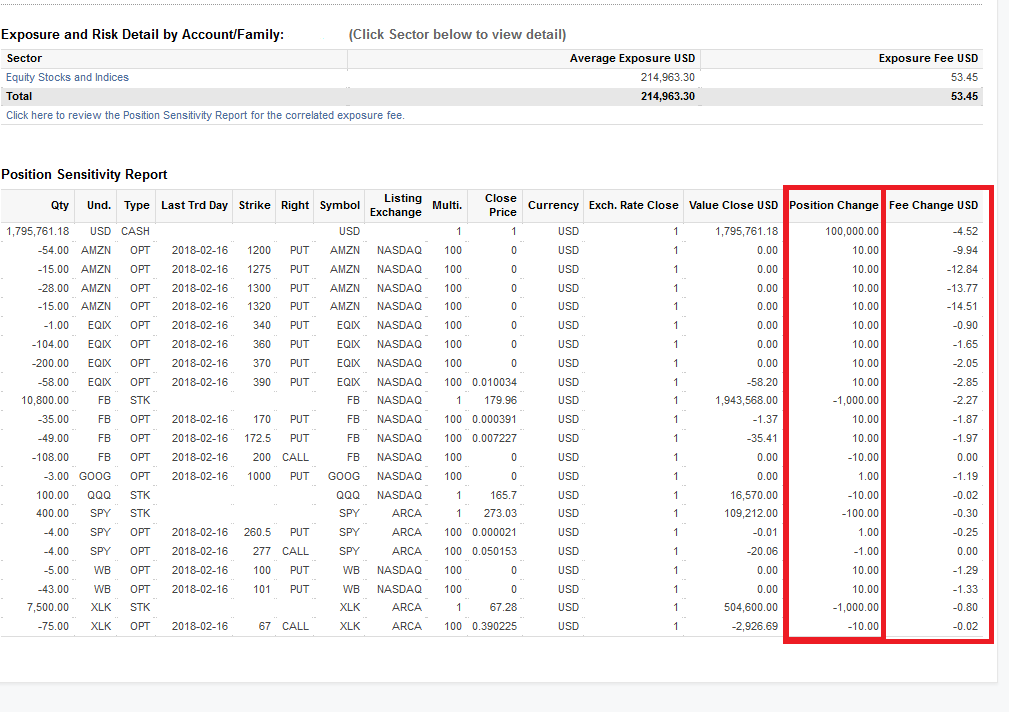
エクスポージャーフィーのサマリーレポートには、各セクターの平均エクスポージャーとそれに対するエクスポージャーフィー1が記載され、さらに相関関係にあるエクスポージャーフィーのセンシティビティ・レポートへのハイパーリンクも含まれています。
セクターサマリー詳細
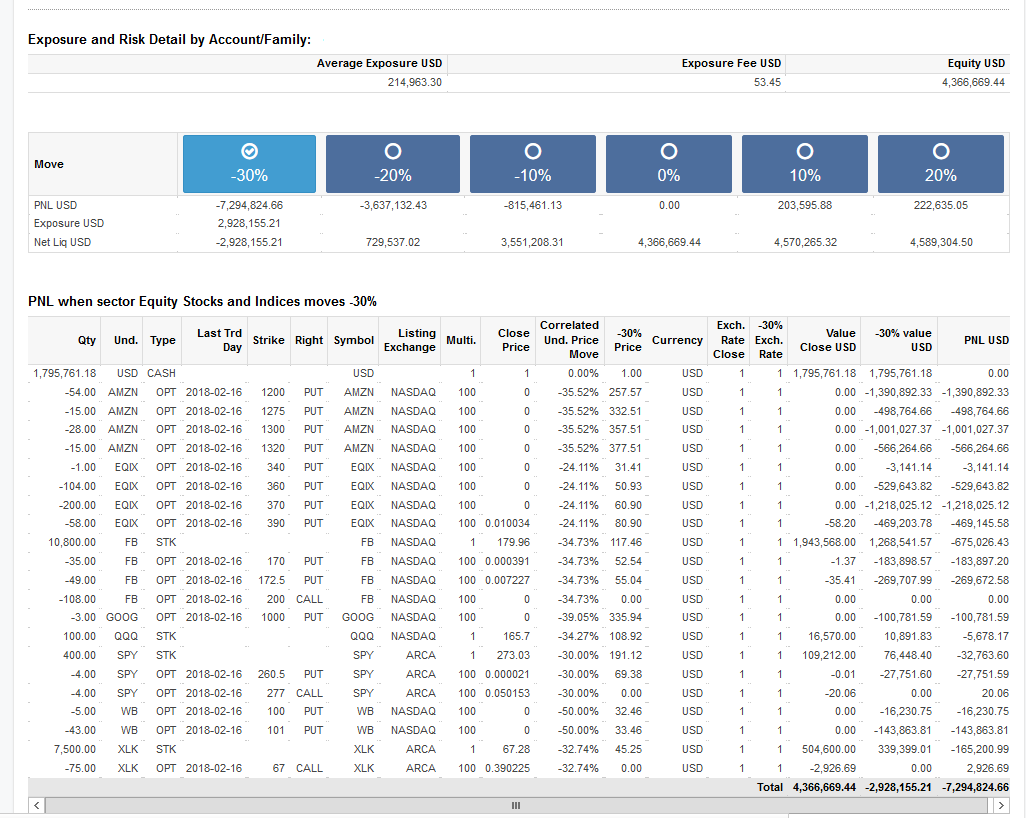
各セクター1のハイパーリンクをクリックするとサマリーの詳細が表示されます。このサマリーでは、該当するETF/Indexの価格が事前に設定される数値だけ上昇/下落する場合のポジションのPNLの変化を確認することができます。株式と指数の例では、SPXが30%、20%、10%下落し、10%、20%独立して上昇すると仮定しています。この結果は理論的な価格モデルに基づいており、デリバティブ価格に影響を与えるボラティリティやその他の変数の偶然の変化を考慮しています。
レポートには以下が記載されます:
- 前日のマーケットクローズからのポジションに基づく口座の流動性資産価値(NLV)
- セクターの平均エクスポージャー
- 該当するエクスポージャーフィー
- すべての保有ポジションのエクイティと基軸通貨表示の損益
レポートを使用するには、確認したい上下の価格変動(+/- 10%、20%または+30%)に対応するラジオボタンをクリックします。各ポジションの想定損益が選択さした割合で更新されます。
下記の図は、-30%を選択した場合の「エクイティの詳細サマリー」の例になります
1口座によっては、1つ以上のセクターの平均エクスポージャーとそれに該当するエクスポージャーフィーが発生します。
相関するエクスポージャーフィーのポジション・センシティビティ・レポート
ポートフォリオ内のすべてのコントラクトのうち、1つのコントラクトのポジションが変更された場合のエクスポージャーフィーの見積もりを計算します。ここでは、あるコントラクトが売買された場合を想定しており、入庫・出庫した場合を想定していません。ポジションの変更はできません。場合によってはショートポジションからロングポジションへの変更など、ポジションの方向を変える必要があることがあります。
エクスポージャーフィーに関する詳細はKB3114をご参照ください。
Exposure Fee Calculation Reports
INTRODUCTION
Our Account Management system lets you configure and manage your account from a single window, including our Exposure Fee Calculations report. The Exposure Fee Calculations is generated daily and made available within Account Management prior to the U.S. equity market open. This report allows users to view the change in Profit and Loss (PnL) of your positions if the price of each of your positions declines and increases by predetermined percentages.
REPORT ACCESS
To access/generate an Exposure Fee Calculations Report
1) From the Account Management Home Page, click on the Reports and then Other Reports menu options.
2) The following screen will appear.
3) Select Exposure Fee Calculations from the Report Type drop-down. Exposure Fee Calculations settings appear
4) In the Date field,select the date for the report
5) Click Run Report
REPORT OVERVIEW
The Exposure Fee Summary Reports reflects the Average Exposure and the corresponding Exposure Fee for each Sector1 and a hyper-link to view our Sensitivity Report for the Correlated Exposure Fee
Detailed Sector Summary
Clicking on the hyper-link associated with each sector1 will populate a detailed summary, which allows users to see the change in the PNL of your positions if the price of the corresponding ETF/Index increases / declines by a pre-determined amount. For the example of Equity Stocks and Indices we are assuming SPX declines by 30%, 20% and 10% and independent increases by 10% and 20% The results are based on theoretical pricing models and take into account coincidental changes in volatility and other variables that affect derivative prices
The report shows:
- The Net Liquidation Value (NLV) of your account based on positions from the previous day’s close
- Average Exposure for the sector
- Corresponding Exposure Fee
- Equity of all positions in the account with PNL in base currency
To use the report, click the radio button that corresponds to the up or down price change you want to see (+/- 10%, 20% or +30%). The PNL for each position is updated by the selected percentage
The following are figure shows an example of a Detailed Summary of the Equity Sector, with -30% selected
1 Accounts may have Average Exposure and a corresponded Exposure Fee for more than 1 Sector
Sensitivity Report for the Correlated Exposure Fee
For every contract in the portfolio we compute an estimate of the exposure fee if the position of a single contract is modified. We assume that contracts are bought or sold, as opposed to transferred in/out. The position change is not editable and in some cases may actually require the account to reverse the direction of their position, for example from a short position to long position.
For additional information regarding the Exposure Fee, please see KB3114
Cryptocurrency Products Offered by IBKR
概観:
Below is a list of many of the Cryptocurrency products offered by IBKR*. If you don't see the product you are looking for, you can search the IBKR contract database through the Contract Search tool available on our website. Select the Support menu followed by your account type (Individual or Institution). Here you can do a Simple search by entering the product name or symbol, an Advanced search which allows you add filters to the search, or a search by specific product type.
Cryptocurrency
- BTC- Bitcoin
- ETH- Ethereum
- LTC- Litecoin
- BCH- Bitcoin Cash
Stocks/ETFs
US
- GBTC (PINK)- Grayscale Bitcoin Investment Trust
- BCHG (PINK)- Grayscale Bitcoin Cash Trust
- ETCG (PINK)- Grayscale Ethereum Classic Trust
- ETHE (PINK)- Grayscale Ethereum Trust
- GDLC (PINK)- Grayscale Digital Large Cap Fund
- LTCN (PINK)- Grayscale Litecoin Trust
Non-US
- BITCOINXB (SFB)- Bitcoin Tracker One
- COINETH (SFB)- XBT Provider Ethereum
- COINETHE (SFB)- XBT Provider Ethereum
Indices
- NYXBT (NYSE)- NYSE Bitcoin Index
- GXBT (Cboe)- The Gemini Bitcoin Trace Price Index (No new contracts offered for trading as of June 2019)
- BRR (CME)- CME Bitcoin Reference Rate Index
- BRTI (CME)- CME Bitcoin Real Time Index
Futures
- GXBT (Cboe/CFE)- The Gemini Bitcoin Trace Price Futures (No new contracts offered for trading as of June 2019)
- BRR (CME)- CME Bitcoin Reference Rate Futures
- ETHUSDRR (CME) – CME Ether Dollar Reference Rate Futures
- BAKKT (ICECRYPTO)- Bakkt Bitcoin Futures
*Some or all of the above products may not be available to IBKR clients located in certain jurisdictions.
Back to Table of Contents: Bitcoin and Other Cryptocurrency Products @ IBKR
Bitcoin and Other Cryptocurrency Products @ IBKR
Cryptocurrency Products Offered by IBKR
Cryptocurrency Products Market Data
Trading Bitcoin Futures with IBKR
Bitcoin Futures Product Page
https://www.interactivebrokers.com/en/index.php?f=25379
IBKR Margin Requirements
https://www.interactivebrokers.com/en/index.php?f=24176
How to update the US Social Security Number (SSN) or Individual Taxpayer Identification Number (ITIN) on your account
Background:
If you have been informed or believe that your account profile contains an incorrect US SSN/ITIN, you may simply log into your Account Management to update this information. Depending on your taxpayer status, you can update your US SSN/ITIN by modifying one of the following documents:
1) IRS Form W9 (if you are a US tax resident and/or US citizen holding a US SSN/ITIN)
2) IRS Form W-8BEN (if you are a Non-US tax resident holding a US SSN/ITIN)
Please note, if your SSN/ITIN has already been verified with the IRS you will be unable to update the information. If however the IRS has not yet verified the ID, you will have the ability to update through Account Management.
How to Modify Your W9/W8
1) To submit this information change request, first login to Account Management
2) Click on the Settings section followed by Account Settings
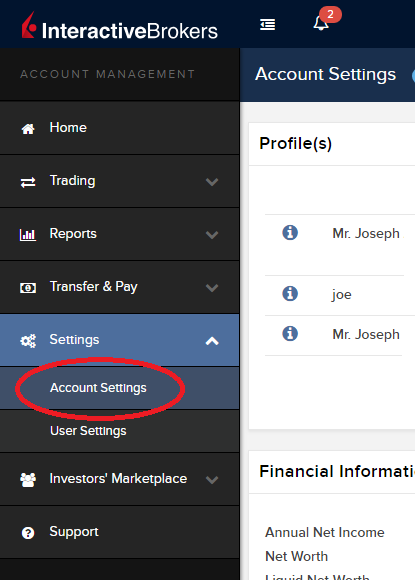
3) Find the Profile(s) section. Locate the User you wish to update and click on the Info button (the "i" icon) to the left of the User's name
.png)
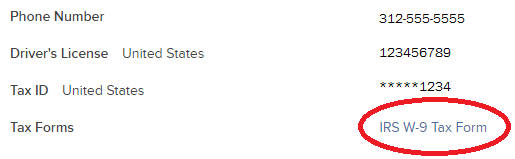
4) Scroll down to the bottom where you will see the words Tax Forms. Next to it will be a link with the current tax form we have for the account. Click on this tax form to open it
5) Review the form. If your US SSN/ITIN is incorrect, click on the UPDATE button at the bottom of the page
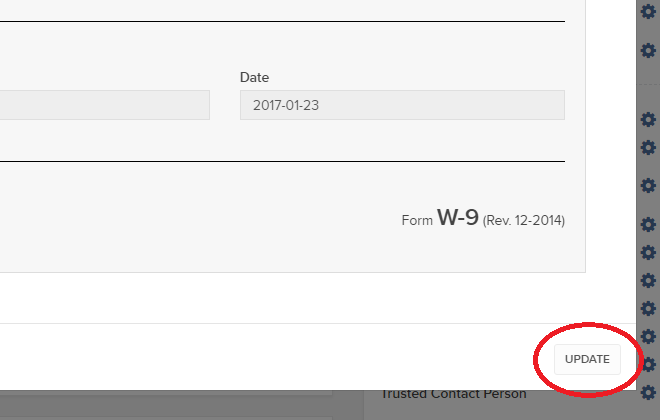
6) Make the requisite changes and click the CONTINUE button to submit your request.

7) If supporting documentation is required to approve your information change request, you will receive a message. Otherwise, your information change request should be approved within 24-48 hours.
How to adjust font size in TWS
Background:
By default, Trader Workstation (TWS) is designed to display in a font size and style which can be read comfortably for the average user across various screen sizes and resolutions. With the advent of new technologies, there has been an exponential push to make monitors with higher display sizes and your layout may need to be further adjusted manually. This document serves to explain how to manually adjust the font size for TWS.
Procedure
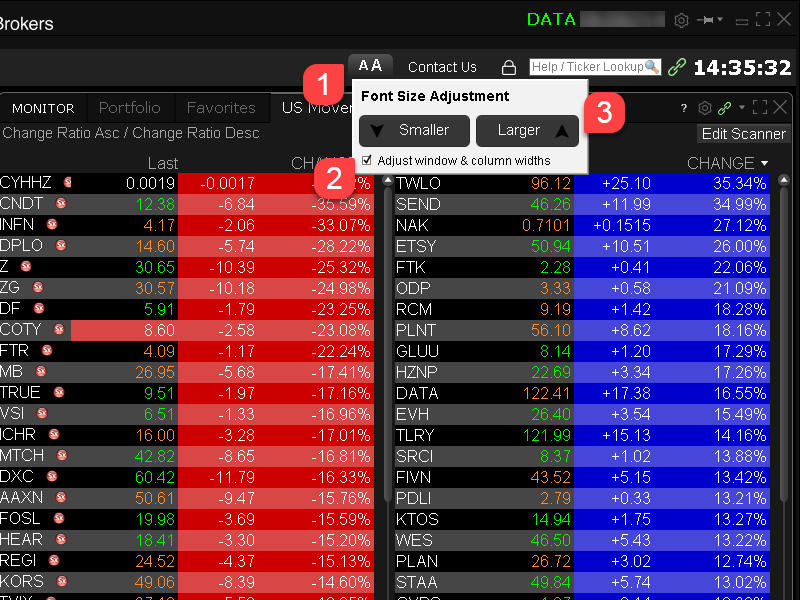
To adjust font size throughout TWS:
- From the Anchor window, click the Font Size Adjustment icon.

- Check the button Adjust window & column widths to ensure all windows will resize automatically to keep the same font:window ratio. (If unchecked, only font size will change but window size will remain the same).
- Click the button Smaller or Larger until the font size is correct.
Notice that the font size will change immediately as you click the button. - Click the Font Size Adjustment icon when done.
Note: It is possible that currently not all windows will be adjusted in the same way.
How to check and solve connectivity issues affecting the Trader Workstation (TWS)
Background:
The Trader Workstation (TWS) software needs to connect to our gateways and market data servers in order to work properly. Connectivity issues affecting your local network or your Internet Service Provider network may negatively affect the TWS functionality. In this article we will indicate how to test your connectivity using an automated connectivity test web page.
How to test the connectivity using the automated "IB Connectivity Test" web page?
1) Launch the Firefox browser and open this link with that browser: http://www.interactivebrokers.com/cgi-bin/conn_test.pl
Note: due to browser specific constraints, the above connectivity test link will only produce consistent results on the Mozilla Firefox browser. If you do not have Firefox, you can download and install it form here.
2) Please wait until all the tests have been completed and results have been displayed. If you see "Success" as outcome for all tests, your connectivity to IB Servers is reliable at the present moment. No additional connectivity troubleshooting or configuration should be needed.
3) If you see "Fail" as outcome for one or more test/s, please click on the link "Fail" itself in order to display the "IB Network Troubleshooting Guide". That section will help you conduct some manual tests to identify the cause of the failure.
Note for Corporative environments and Proxy server users: the automated "Connectivity Test" page may return misleading results in case your machine is accessing the Internet through a Proxy server. This usually happens if you are connected to a company network. If this is your case, we kindly ask you to contact your Network Administrator or your IT Team and ask them to perform a manual connectivity tests towards the destination servers indicated in the table on the top of the IB automated "Connectivity Test" web page itself. The manual connectivity test should be conducted using destination TCP ports 4000 and 4001. Should they prefer to have the server list in another format or should they need to set up the firewall / IP Management rules, you can forward them this page.
IBKR Mobile Companion App for Apple Watch
概観:
Interactive Brokers takes our intuitive and ergonomic mobile trading platform to the next level by providing you a companion app for the Apple Watch.
Background:
The companion app is designed to display information when a user has logged in to the IBKR Mobile app on their iPhone. It will work in both the Live Trading and Read Only Modes but does not support active trading. This companion app is only available for informational purpose only.
Table of contents
What does the app do?
At 'glance view' the app will display the following information; Amount of FYI Notification, Account Number, Daily P&L, Net Liquidation Value, Number of Open Orders, Number of Trades Executed, Excess Liquidity and number of Positions you currently own. It will also display the time when it has fetched the information from your iPhone.
Example:
.jpg)
Requirements
- Must have iPhone 5s or greater, using iOS 11 or later.
- Must have the IBKR Mobile app installed on your iPhone (version 11 or greater)
- Must have your Apple Watch paired to your iPhone (refer to: Set up your Apple Watch for directions)
- Must have watchOS 5 running on your Apple Watch.
Important: The Apple Watch applications are only 'companion' apps. This means they are not installed directly on the watch itself, but rather are a function of an application already installed on your iPhone.
How is the app installed?
1. Install the latest version of the IBKR Mobile app on your iPhone.
2. Pair your Apple Watch to your phone.
3. Launch the Watch app on your phone.
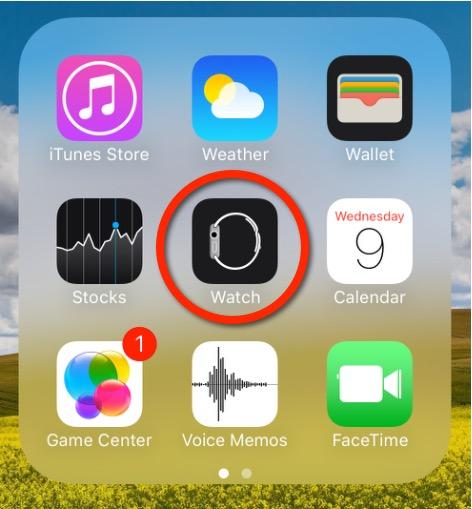
4. Scroll down on the main screen until you see your list of apps, locate the IBKR Mobile app and Tap on it.
.jpg)
5. Enable Show App on Apple Watch by swiping the slider to the right (green).
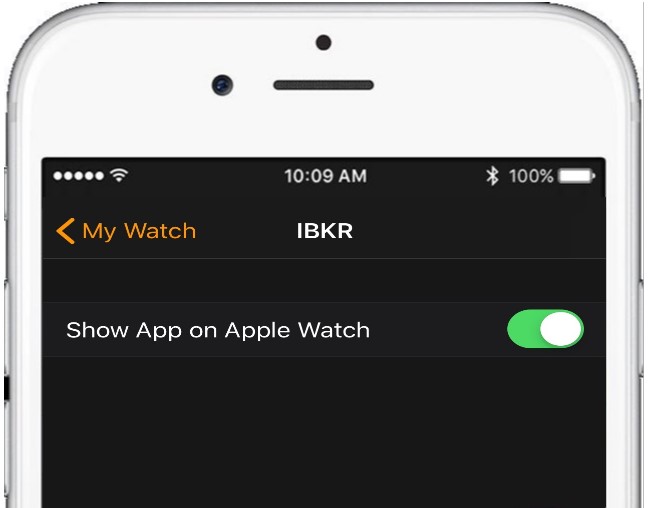
6. After the top slider is set to green, you will see a text informing you that the app is being installed. At this stage the phone is sending the application to your watch per Bluetooth. This might take a short moment (approximately 30-60 seconds.) Once completed the companion app has been installed.
Note: Once enabled it will take 24 hours before P&L shows up on the watch after activation.
How do I confirm the app is installed?
On your Apple Watch click on the crown to access your Home Screen, you should now see an icon for the IBKR Mobile App.