Momentaufnahmen zu Marktdaten
HINTERGRUND
IBKR bietet berechtigten Kunden die Möglichkeit an, Kursnotierungen in Echtzeit für ein einzelnes Instrument auf Anfrage zu erhalten. Dieser Service, auch „Momentaufnahmen von Kursnotierungen” genannt, unterscheidet sich wesentlich vom herkömmlichen Kursnotierungsservice, der einen kontinuierlichen Streamingdienst darstellt und Updates zu Kursen in Echtzeit bereitstellt. Momentaufnahmen von Kursnotierungen werden Kunden als preisgünstige Alternative angeboten, die nicht regelmäßig handeln und sich bei der Übermittlung einer Order nicht auf verzögerte Kursnotierungen verlassen möchten. Nachstehend erhalten Sie zusätzliche Details zu diesem Kursnotierungsservice.
Kursnotierungskomponenten
Die Momentaufnahme der Kursnotierung enthält folgende Daten:
- Letztkurs
- Letzte Handelsmenge
- Letztkurs-Börse
- Aktueller Geld-/Briefkurs
- Menge für den jeweiligen Geld-/Briefkurs
- Börse für den jeweiligen Geld-/Briefkurs
VERFÜGBARE DIENSTE
| Dienst | Einschränkungen | Preis pro Kursnotierungsanfrage (USD)1 |
|---|---|---|
| AMEX (Network B/CTA) | $0.01 | |
| ASX Total | Kein Zugang zur ASX24. Eingeschränkt auf nicht professionelle Abonnenten |
$0.03 |
| Bolsa de Madrid | $0.03 | |
| Canadian Exchange Group (TSX/TSXV) | Eingeschränkt auf nicht professionelle Abonnenten, die nicht Kunden bei IB Canada sind | $0.03 |
| CBOT, Echtzeit | $0.03 | |
| CME, Echtzeit | $0.03 | |
| COMEX, Echtzeit | $0.03 | |
| Eurex Core | Eingeschränkt auf nicht professionelle Abonnenten | $0.03 |
| Euronext Basic | Eingeschränkt auf nicht professionelle Abonnenten Umfasst Aktien, Indizes, Aktienderivate sowie Indexderivate von Euronext. |
$0.03 |
| Deutsche ETFs und Indizes | Eingeschränkt auf nicht professionelle Abonnenten | $0.03 |
| Hong Kong (HKFE) Derivative | $0.03 | |
| Hong Kong Securities Exchange (Aktien, Optionsscheine, Anleihen) | $0.03 | |
| Johannesburg Stock Exchange | $0.03 | |
| Montreal Derivatives | Eingeschränkt auf nicht professionelle Abonnenten | $0.03 |
| NASDAQ (Network C/UTP) | $0.01 | |
| Nordic Derivatives | $0.03 | |
| Nordic Equity | $0.03 | |
| NYMEX, Echtzeit | $0.03 | |
| NYSE (Network A/CTA) | $0.01 | |
| OPRA (US-Optionsbörsen) | $0.03 | |
| Shanghai Stock Exchange, 5-Sekunden-Momentaufnahme (via HKEx) | $0.03 | |
| Shenzhen Stock Exchange, 3-Sekunden-Momentaufnahme (via HKEx) | $0.03 | |
| SIX Swiss Exchange | Eingeschränkt auf nicht professionelle Abonnenten | $0.03 |
| Spot Market Germany (Frankfurt/Xetra) | Eingeschränkt auf nicht professionelle Abonnenten | $0.03 |
| STOXX Index, Echtzeitdaten | Eingeschränkt auf nicht professionelle Abonnenten | $0.03 |
| Toronto Stk Exchange | Eingeschränkt auf nicht professionelle Abonnenten, die Kunden bei IB Canada sind | $0.03 |
| TSX Venture Exchange | Eingeschränkt auf nicht professionelle Abonnenten, die Kunden bei IB Canada sind | $0.03 |
| UK LSE (IOB) Equities | $0.03 | |
| UK LSE Equities | $0.03 |
1Die Kosten pro Momentaufnahme für eine Kursnotierung werden in einer zur Basiswährung äquivalenten Währung erhoben (falls nicht USD).
BERECHTIGUNG
- Konten müssen ein Kapital von mindestens 10.00 USD oder einen äquivalenten Wert in einer anderen Währung verfügen, um sich für Momentaufnahmen von Kursnotierungen zu qualifizieren.
- Nutzer müssen die TWS Version 976.0 oder höher verwenden, um auf die Momentaufnahmefunktion für Kursnotierungen verwenden zu können.
DETAILS ZUR PREISSTRUKTUR
- Kursnotierungsgebühren werden im Nachhinein erhoben; grundsätzlich in der ersten Woche des darauffolgenden Monats, in dem der Momentaufnahme-Service genutzt wurde. Konten, die nicht über ausreichende Barmittel oder ein Kapital mit Darlehenswert verfügen, um die monatliche Gebühr zu begleichen, unterliegen Positionsliquidierungen.
- Die monatliche Gebühr für AMEX (Network B/CTA), NASDAQ (Network C/UTP) und NYSE (Network A/CTA) wird gedeckelt und Streaming-Kursnotierungen kostenlos für den Rest des Monats bereitgestellt, sofern der Nutzer das Momentaufnahme-Datenpaket abonniert hat und die Anzahl an Kursnotierungsanfragen für den Monat genauso viel wie die Kosten des Streamingdienstes betragen. Der Wechsel zu Streaming-Kursnotierungen wird ungefähr um 18:30 Uhr EST des nachfolgenden Geschäftstages stattfinden, nachdem die Schwelle für Momentaufnahmen erreicht wurde. Am Ende des Monats wird der Streamingdienst automatisch beendet und der Zähler für Momentaufnahmen zurückgesetzt. Jeder Dienst wird unabhängig von einander gedeckelt, wobei Kursnotierungsanfragen für einen Dienst nicht zur Deckelung eines anderen angerechnet werden können. In der nachstehenden Tabelle erhalten Sie weitere Details.
| Dienst | Preis pro Kursnotierungsanfrage (USD) | Deckelung für nicht professionelle Abonnenten (Anfragen/Gesamtkosten)2 | Deckelung für professionelle Abonnenten (Anfragen/Gesamtkosten)3 |
|---|---|---|---|
| AMEX (Network B/CTA) | $0.01 | 150/$1.50 | 2,300/$23.00 |
| NASDAQ (Network C/UTP) | $0.01 | 150/$1.50 | 2,500/$25.00 |
| NYSE (Network A/CTA) | $0.01 | 150/$1.50 | 4,500/$4,500 |
2Erfordert ein Abonnement des Vorteilspakets für US-Wertpapier-Momentaufnahmen und Futures.
3Erfordert ein Abonnement des Vorteilspakets für US-Wertpapier-Momentaufnahmen.
SO STELLEN SIE ANFRAGEN FÜR EINE MOMENTAUFNAHME EINER KURSNOTIERUNG
Desktop-Trading - TWS (Classic):
Falls Ihnen verzögerte Daten angezeigt werden und Sie Momentaufnahmeberechtigungen abonniert haben, können Sie unterhalb der Spalte Ticker-Aktion eine Schaltfläche namens Momentaufnahme sehen:

Wenn Sie auf die Schaltfläche Momentaufnahme klicken, wird das Kursnotierungsdetailfenster automatisch ausgefüllt. Das Kursnotierungsdetailfenster erstellt einen Zeitstempel zu dem Zeitpunkt, zu dem die NBBO-Kursnotierung für das Symbol zusammen mit den Informationen zum besten nationalen Geld-/Briefkurs erhalten wurden:
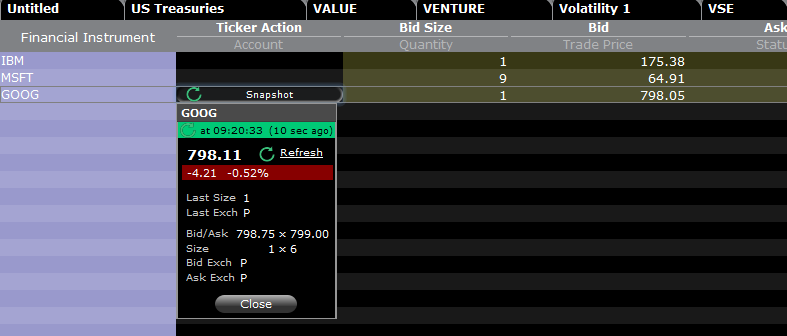
Wenn Sie im Kursnotierungsdetailfenster auf den Link Aktualisieren klicken, wird die NBBO-Kursnotierung aktualisiert.
Beispiel:
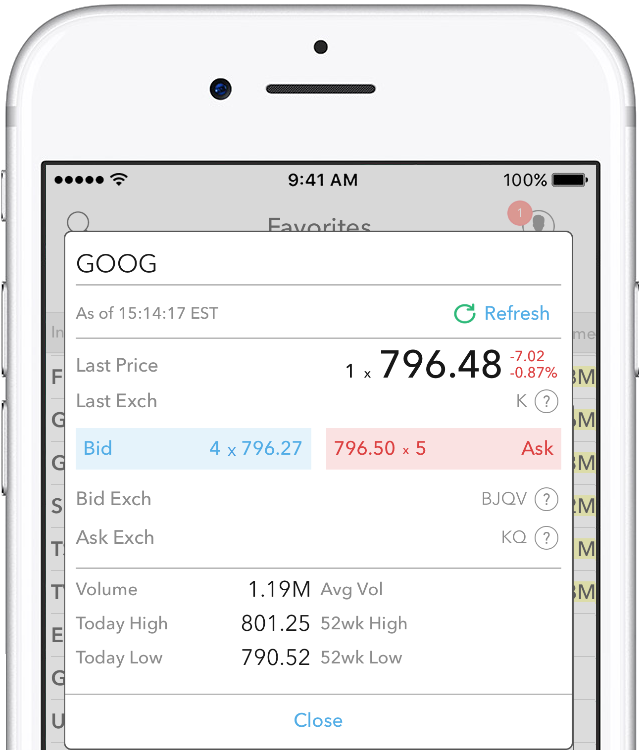
In dem vorstehenden Beispiel handelt es sich bei GOOG um eine bei der NASDAQ (Network C/UTP) notierte Aktie. Es wird eine Gebühr von 0.01 USD pro Anfrage (eine Momentaufnahme) erhoben.
- Nicht professionelle Abonnenten können weitere 149 Momentaufnahmen für GOOG oder jegliche andere bei der NASDAQ (Network C/UTP) notierte Aktien anfordern, bevor dieser Dienst zu einem Streamingdienst für Kursnotierungen umgewandelt wird.
- Professionelle Abonnenten können weitere 2,499 Momentaufnahmen für GOOG oder jegliche andere bei der NASDAQ (Network C/UTP) notierte Aktien anfordern, bevor dieser Dienst zu einem Streamingdienst für Kursnotierungen umgewandelt wird.
Sie werden ausschließlich für Momentaufnahmen bis zum Deckelungsbetrag aufkommen müssen. Sobald das Momentaufnahmelimit erreicht wurde, werden keine weiteren Änderungen für den restlichen Monat angewandt und stattdessen erhalten Sie Streaming-Kursnotierungen für diesen Dienst.
Desktop-Trading - TWS (Mosaic):
Falls Ihnen verzögerte Daten angezeigt werden und Sie Momentaufnahmeberechtigungen abonniert haben und Sie eine Zeile in der Kursmonitor-Registerkarte auswählen, wird das Ordereingabefenster die Option zur Anforderung einer Momentaufnahme anzeigen.
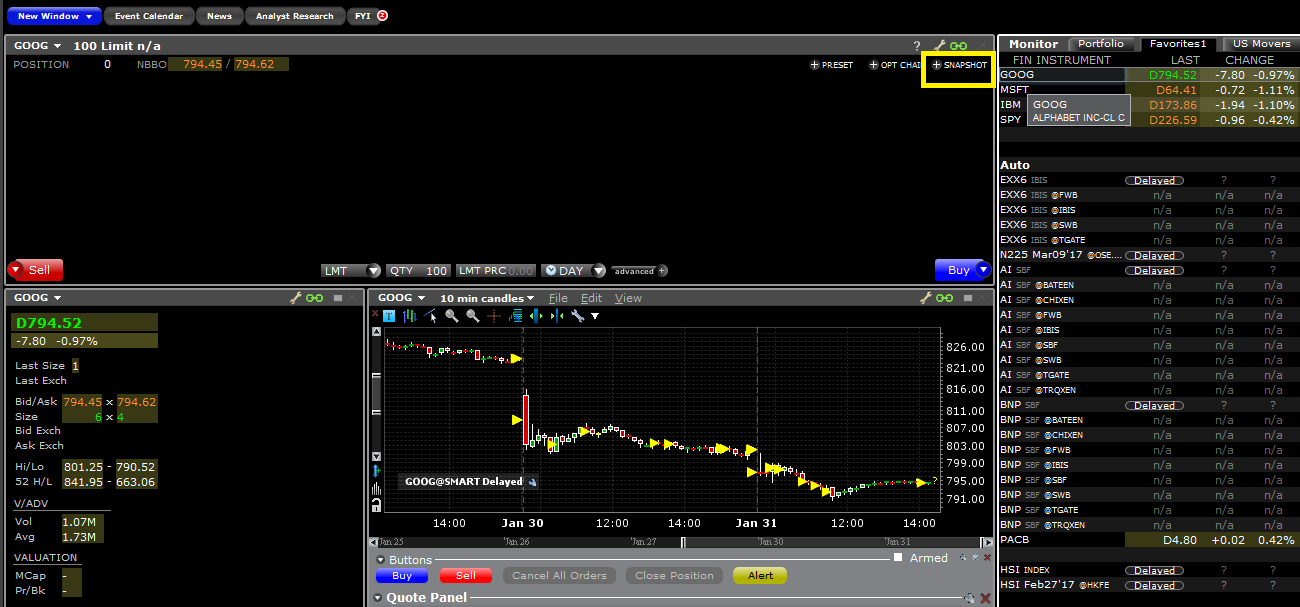
Wenn Sie auf den Link +MOMENTAUFNAHME klicken, wird das Kursnotierungsdetailfenster ausgefüllt. Das Kursnotierungsdetailfenster erstellt einen Zeitstempel zu dem Zeitpunkt, zu dem die NBBO-Kursnotierung für das Symbol zusammen mit den Informationen zum besten nationalen Geld-/Briefkurs erhalten wurden:
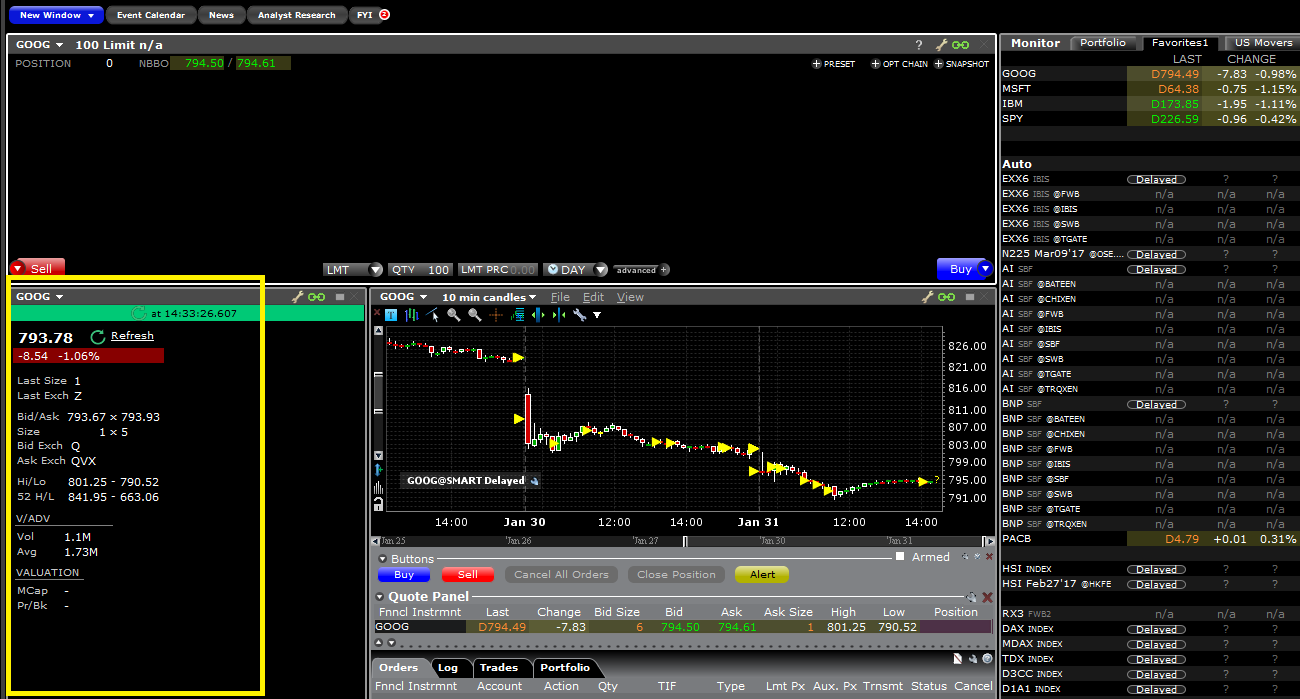
Wenn Sie im Kursnotierungsdetailfenster auf den Link Aktualisieren klicken, wird die NBBO-Kursnotierung aktualisiert.
Client Portal:
Falls Sie verzögerte Daten empfangen und Momentaufnahmen abonniert haben, können Sie im Orderticketfenster unterhalb des Geld-/Briefkurses einen Link für Momentaufnahmen sehen:
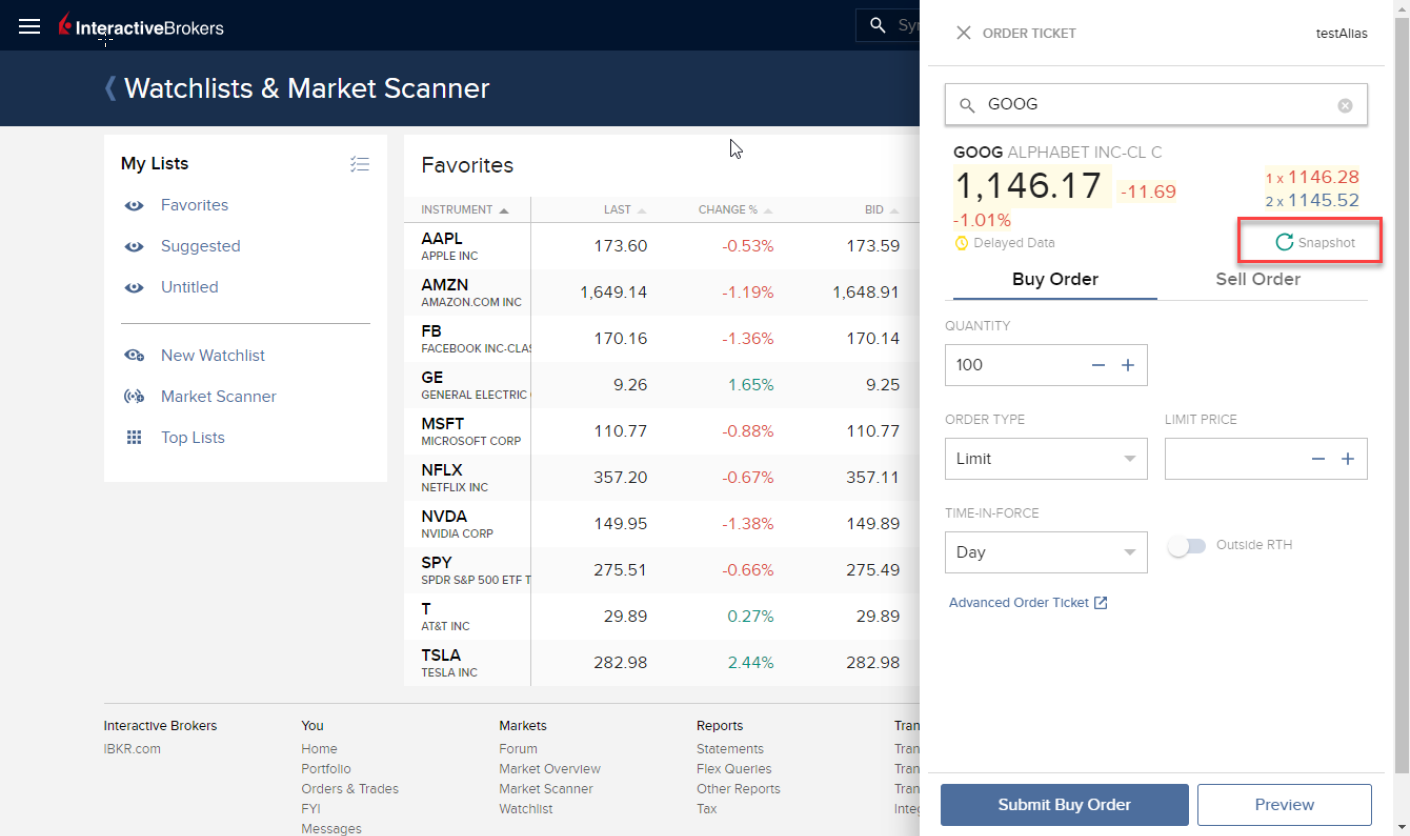
Wenn Sie auf den Link Momentaufnahme klicken, wird das Kursnotierungsdetailfenster automatisch ausgefüllt. Das Kursnotierungsdetailfenster erstellt einen Zeitstempel zu dem Zeitpunkt, zu dem die NBBO-Kursnotierung für das Symbol erhalten wurde:
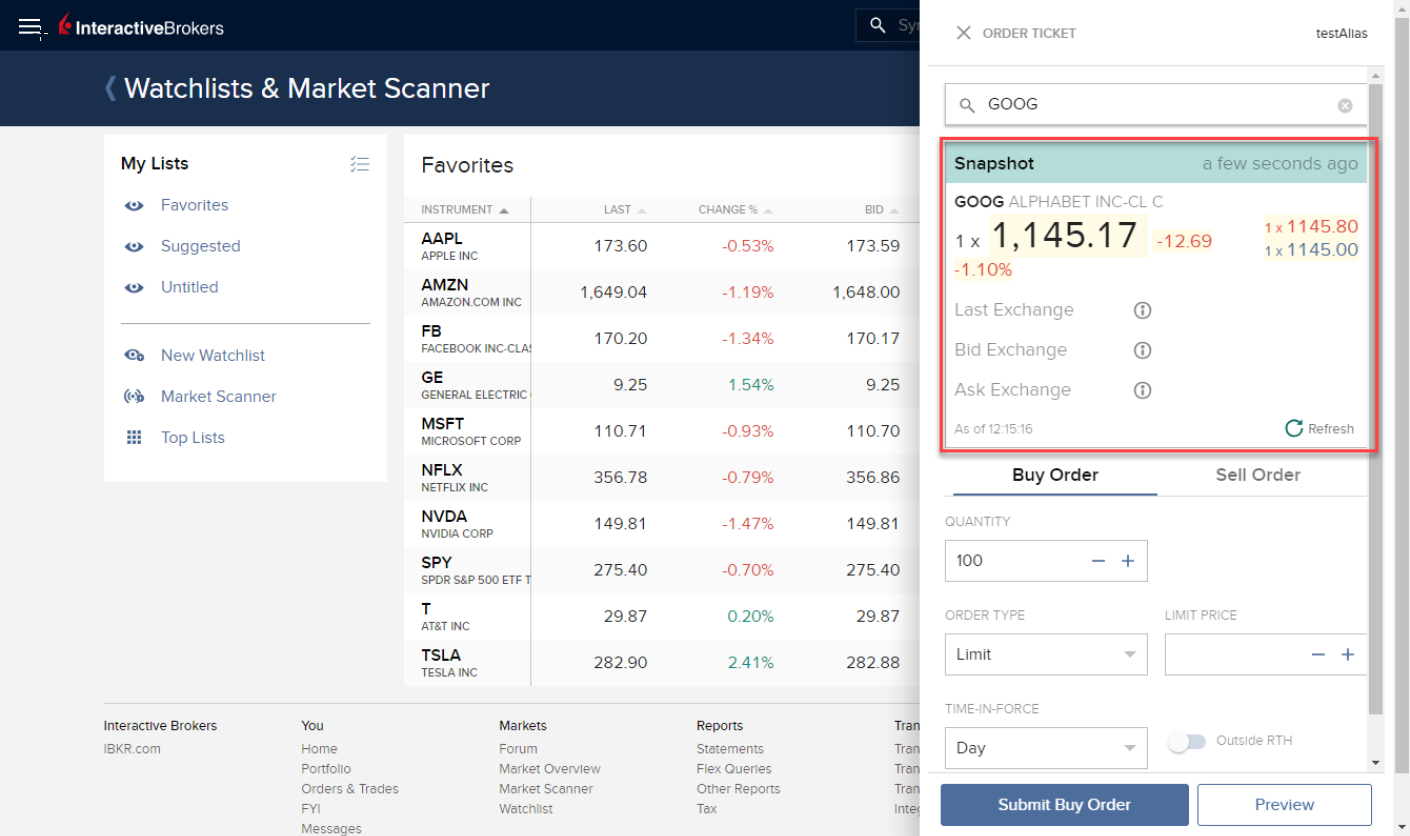
Wenn Sie im Momentaufnahmefenster auf den Link Aktualisieren klicken, wird die NBBO-Kursnotierung aktualisiert.
Online-Trading - WebTrader:
Falls Sie verzögerte Daten empfangen und Momentaufnahmen abonniert haben, können Sie in der Marktregisterkarte unterhalb der Spalte Zusätzliche Daten eine Schaltfläche für Momentaufnahmen sehen:
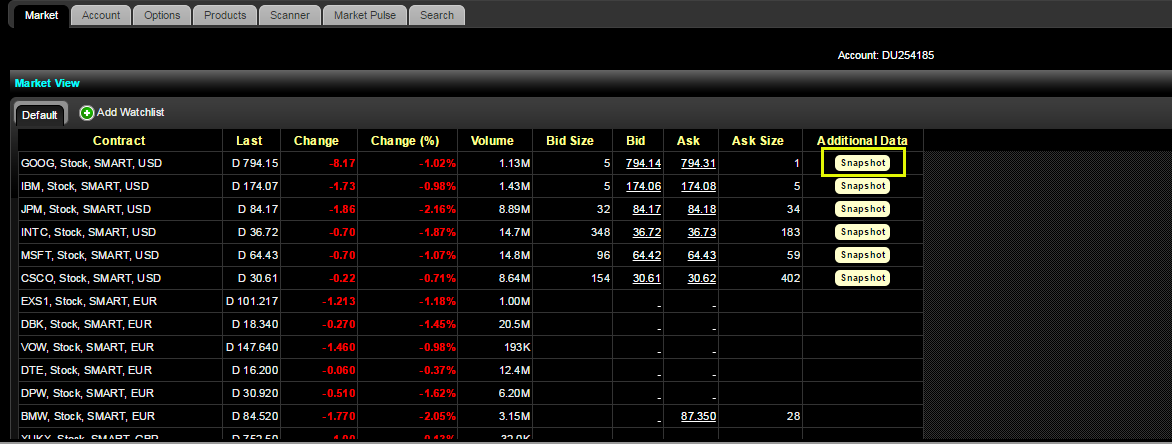
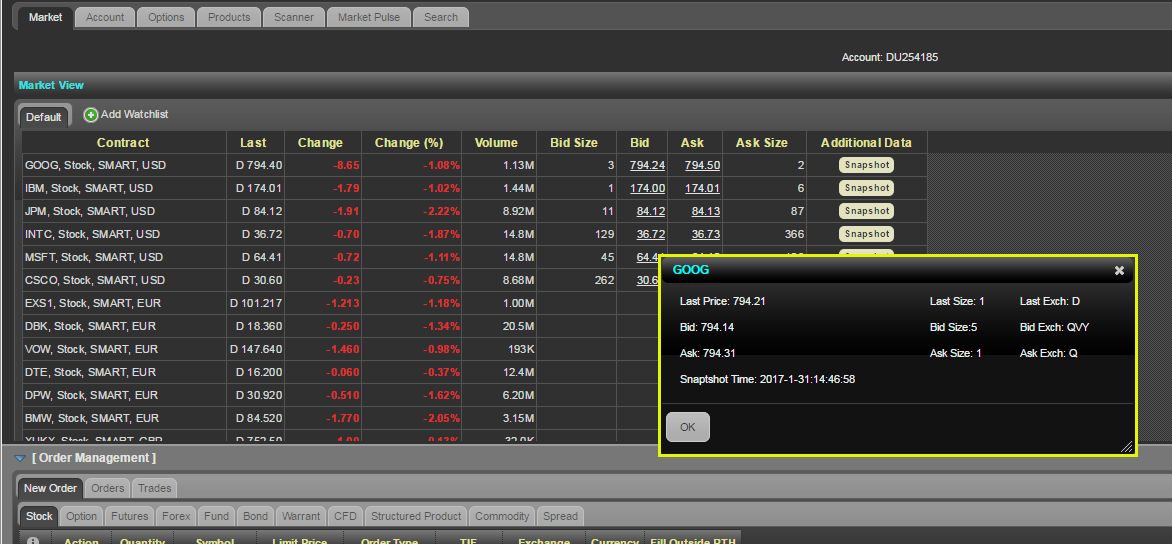
Wenn Sie auf die Schaltfläche Momentaufnahme klicken, wird das Kursnotierungsdetailfenster automatisch ausgefüllt. Das Kursnotierungsdetailfenster erstellt einen Zeitstempel zu dem Zeitpunkt, zu dem die NBBO-Kursnotierung für das Symbol erhalten wurde:
Mobiler Handel - IBKR-Mobile-App:
Wenn Sie auf dem Kursnotierungsbildschirm auf ein Symbol tippen, wird das Kursnotierungsfeld erweitert. Falls Sie verzögerte Daten empfangen und Momentaufnahmen abonniert haben, können Sie einen Link für Momentaufnahmen sehen:
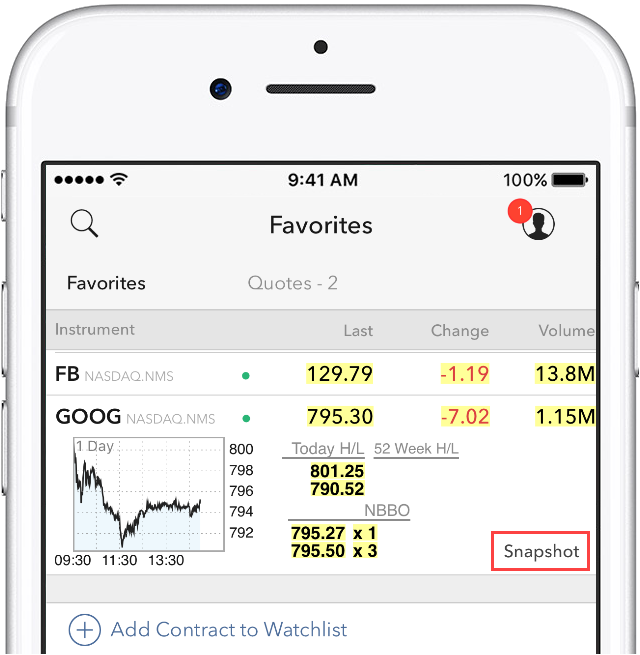
Wenn Sie auf den Link Momentaufnahme tippen, wird das Kursnotierungsdetailfenster automatisch ausgefüllt. Das Kursnotierungsdetailfenster erstellt einen Zeitstempel zu dem Zeitpunkt, zu dem die NBBO-Kursnotierung für das Symbol zusammen mit den Informationen zum besten nationalen Geld-/Briefkurs erhalten wurden:
Why do I receive a message stating market data is over the limit?
When you open an account with IBKR, you are initially set to receive a minimum of 100 concurrent lines of market data. This means that, either on IBKR Trading Platforms (TWS, IBKR Mobile, Client Portal trading facility) or on API/third party interface, you can simultaneously feed 100 tickers with market data. As explained here, after the first month of trading, your allowance might be increased either automatically (based on your account equity/commission) or manually (by the purchase of Quote Booster packs.)
Note: The same market data allowance is set for all the users of the same account, since it is based on account-wise parameters such as commissions and equities.
Table of contents
Why some financial instruments show question marks instead of data?
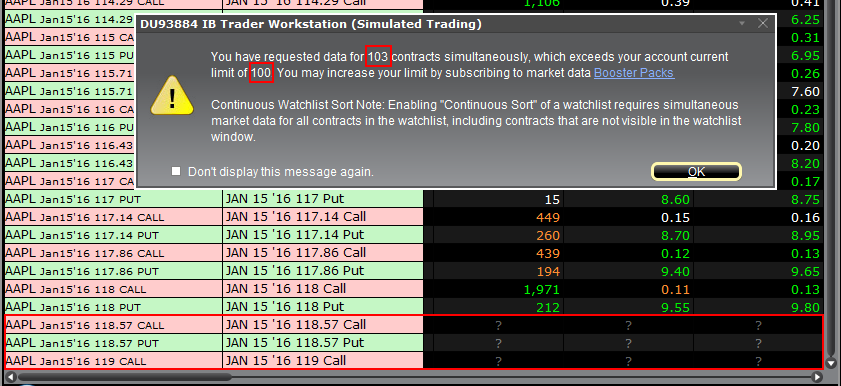
There are various functions and tools in TWS using market data: watchlists, charts, trading or analytical tools, alarms. In general, any foreground window which actively uses market data for display or for calculations, will increase the total number of market data channels currently opened. Once you have exceeded the maximum Market Data allowance for your account, you will be prevented from receiving additional market data. In this case, one or more tickers will show a "?" instead of actual quotes and your TWS will display the following warning message:
"You have requested data for XXX contracts simultaneously, which exceeds your account current limit of YYY. You may increase your limit by subscribing to market data Booster Packs."
Note: If you have decided to hide the warning by ticking the checkbox "Don't display this message again", you will not see it again next times you exceed the market data limit. Nevertheless you will still see "?" for one or more tickers instead of the actual quotes.
Where can I check the current market data allowance?
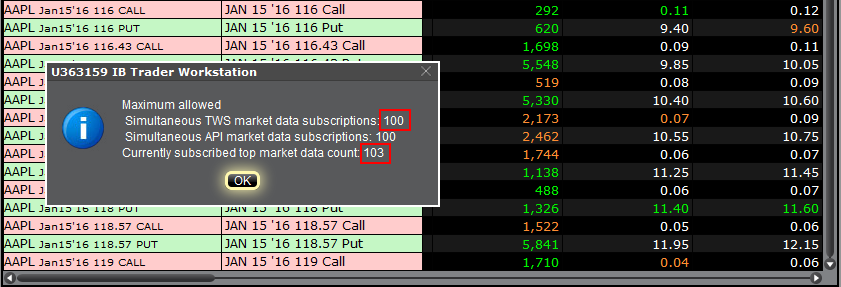
Within TWS, you can check how much of your total market data allowance you are currently consuming in the "Maximum Allowed" window. While in TWS, press the keys Ctrl + Alt + = (on a MAC click: Control + Option + =) and you will see the Maximum allowed pop-up indicating the market data allowance (the value close to "Simultaneous TWS market data subscriptions") and the market data lines currently used (the value close to "Currently subscribed top market data count".)
Which solutions are available to me?
-
Reduce the number of financial instruments displayed within your trading platform
To overcome an excessive market data usage, the easiest solution is to reduce the amount of financial instruments present within your trading platform. Here below are some ways to accomplish that:
a. Delete some tickers from your watchlist(s). There might be old tickers you are no longer interested in or there may be expired contracts. Deleting those will reduce the overall market data usage.
b. Minimize or hide one or more watchlist or other tools consuming market data. Only the TWS windows which are active and in the foreground contribute to market data count. If you have floating watchlists/charts and you minimize them or send them to the background, you will actually decrease the overall market data usage by the number of tickers present on those watchlists/charts
c. Use more restrictive filters within Option Trader / Option Chains / Strategy Builder. Those tools often become top market data consumers due to the high number of option contracts they display. All those tools provide filtering based on strike / expiry / trading class. By acting on those filters you can reduce the number of option contracts displayed
Note: Some derivatives contracts (Futures, Options, Future Options) will often consume two market data channel, one for the contract himself and one for the underlying, since the underlying contract is used for Greeks / Volatility calculations
-
Purchase Quote Booster pack(s)
Each Quote Booster pack will cost you 30 USD monthly and will entitle you to 100 additional market data lines (on the top of your current allotment). The maximum number of Quote Booster packs you can purchase for your account is 10.
How to fix the "Cannot create ... file" error during TWS installation on MacOS
The filesystem permissions are controlled by your machines operating system. One of their functions is to secure your files, preventing unauthorized access or undesired modifications to the system and to your personal data.
Some software on your computer may modify or override the permissions assigned by the operating system. Under certain circumstances, this prevents the TWS installer from accessing the folder where the application core files have to be created (/users/youruser/home/Applications). In such cases, the TWS installation usually displays the error "Cannot create ... file. Shall I try again?"
Procedure:



.png)

.png)
.png)
7. Once the installation has completed successfully, repeat the previous steps from 1. to 5. setting back the permissions of “everyone” to “Read Only” to revert your changes to the initial status
Complex Position Size
For complex, multi-leg options positions comprising two or more legs, TWS might not track all changes to this position, e.g. a vertical spread where the short leg is assigned and the user re-writes the same leg the next day, or if the user creates a the position over multiple trades, or if the order is not filled as a native combination at the exchange.
Vereinigung der IB TWS und des IB Key in IBKR Mobile
ÜBERSICHT
Die Übertragung Ihres Benutzers hängt von den jeweiligen Apps ab, die Sie momentan verwenden:
1. Sie verwenden Ihr Smartphone ausschließlich für Handelszwecke (IB TWS ist installiert) - Klicken Sie hier
2. Sie verwenden Ihr Smartphone ausschließlich für Authentifizierungszwecke (IB Key ist installiert) - Klicken Sie hier
3. Sie verwenden Ihr Smartphone sowohl für Handels- als auch Authentifizierungszwecke (IB TWS und IB Key sind installiert) - Klicken Sie hier
4. Sie verwenden Ihr Smartphone für Transaktionen mit Ihrer Debit Card (IB Key ist installiert) - Klicken Sie hier
Sie verwenden die IB TWS
Sie haben bisher Handelsgeschäfte auf Ihrem Smartphone über die IB TWS ausgeführt und den IB Key noch nicht verwendet.
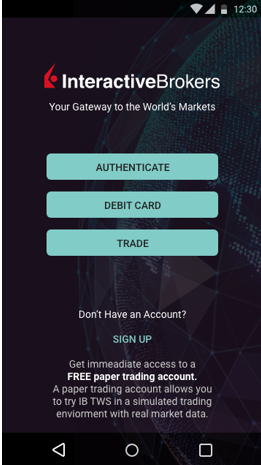
1. Beim erstmaligen Start der Anwendung werden Sie den folgenden Startbildschirm sehen.
Auf Abbildung 1 ist der Startbildschirm von IBKR Mobile für iOS-Geräte zu sehen. Auf Abbildung 2 sehen Sie die entsprechende Version für Android-Geräte.
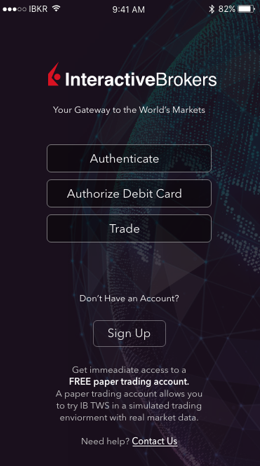
Abbildung 1 Abbildung 2
2. Tippen Sie auf die Schaltfläche „Handel”.
3. Die restlichen Anwendungsabläufe sind identisch mit den Anwendungen, die Sie in der Vergangenheit genutzt haben.
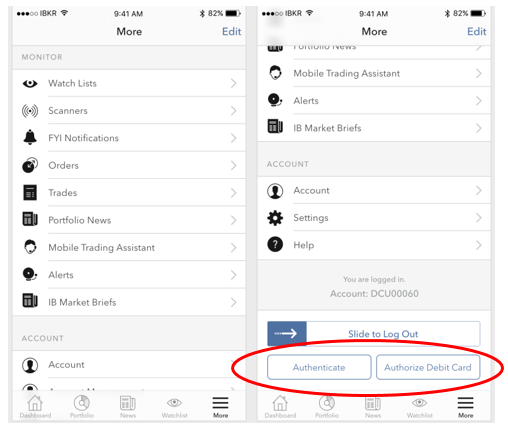
Zugang zu weiteren Funktionen vom Handelsbildschirm aus
Falls Sie auf weitere Funktionen von IBKR Mobile zugreifen möchten, wie z. B. das Authentifizierungsmodul oder
Debit-Card-Funktionen:
Bei iOS-Geräten (Abbildung 3)
1. Öffnen Sie das Menü „Mehr” (unten rechts in Ihrem Bildschirm).
2. Scrollen Sie bis zum Ende der Seite herunter
Bei Android-Geräten (Abbildung 4)
1. Öffnen Sie das Anwendungsmenü
2. Scrollen Sie zum Ende der Rubrik - „App-Einstellungen”
.png)
Abbildung 3 Abbildung 4
Sie verwenden den IB Key
Aktivierung
1. Starten Sie IBKR Mobile und tippen Sie auf „Authentifizierung”.
2. Die App wird den installierten IB Key erkennen und Ihnen eine Handlungsoption anbieten - entweder eine
automatische Übertragung (Abbildung 5) oder eine Aktualisierung und danach eine automatische Übertragung.
Zudem haben Sie die Möglichkeit, die Übertragung manuell und zu einem späteren Zeitpunkt durchzuführen.
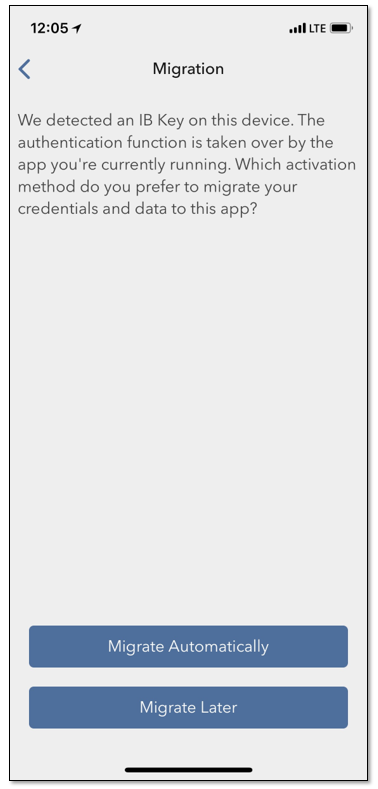
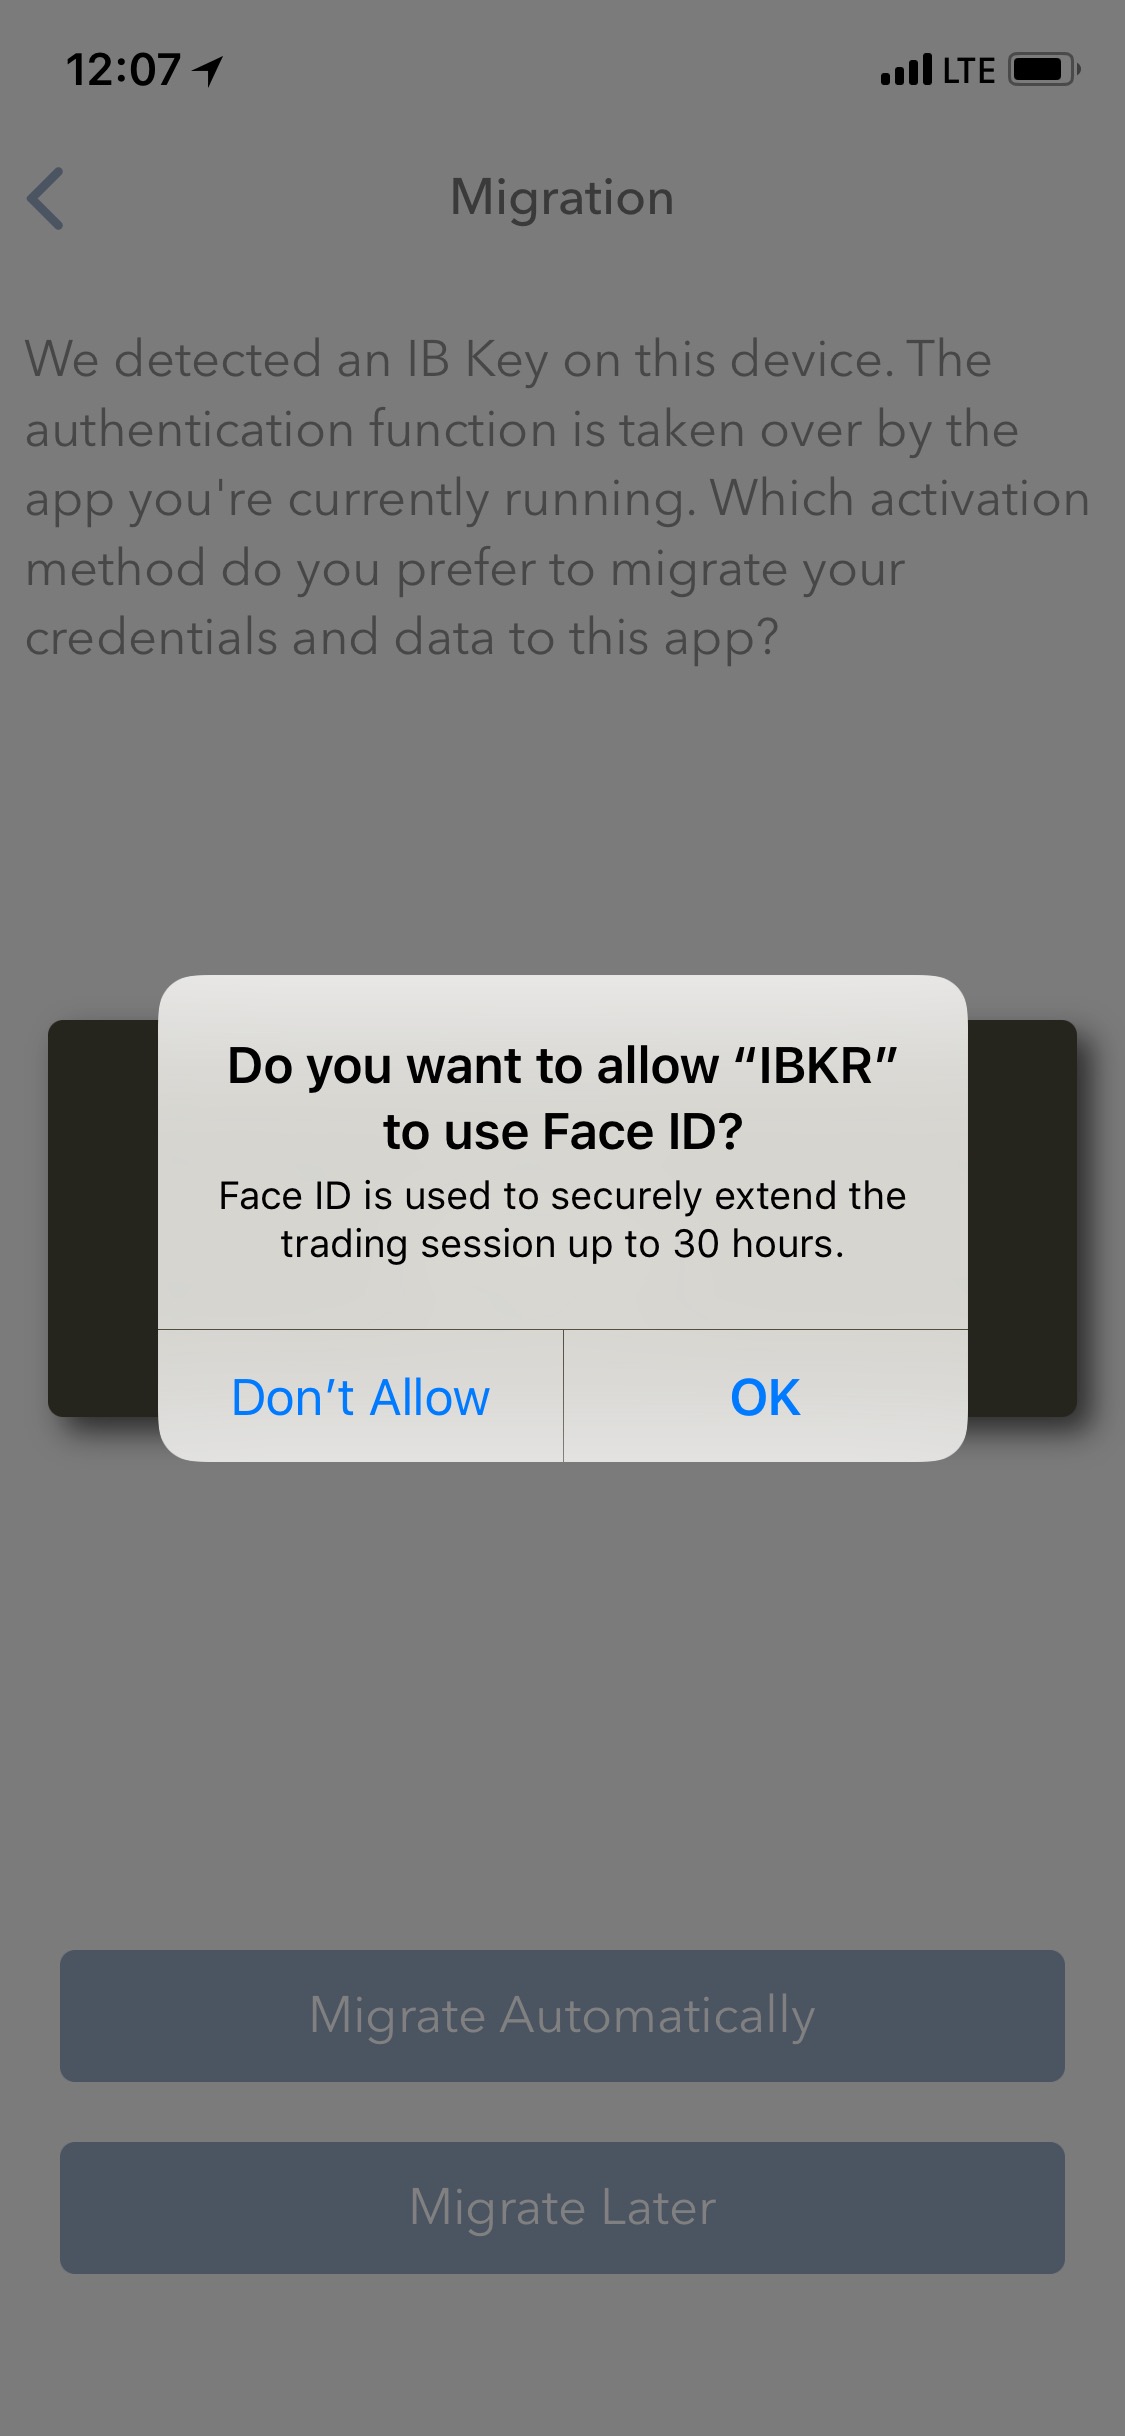
Abbildung 5 Abbildung 6 Abbildung 7
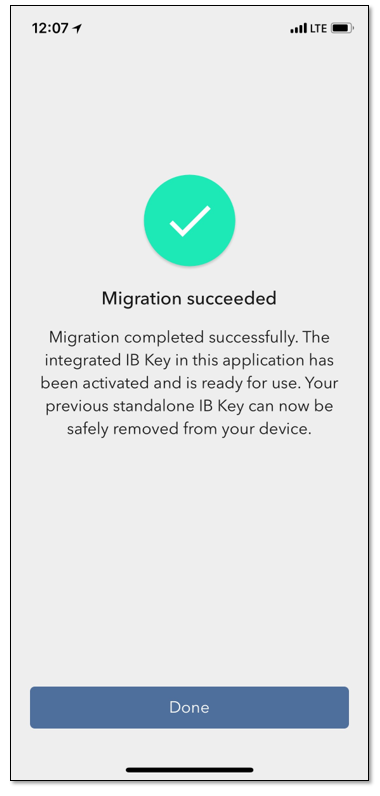
Nachdem die Übertragung abgeschlossen wurde, sollten Sie die IB-Key-Standalone-Anwendung starten - diejenige, über die Sie
sich in der Vergangenheit authentifiziert haben - und der folgende Bildschirm wird erscheinen (Abbildung 8).
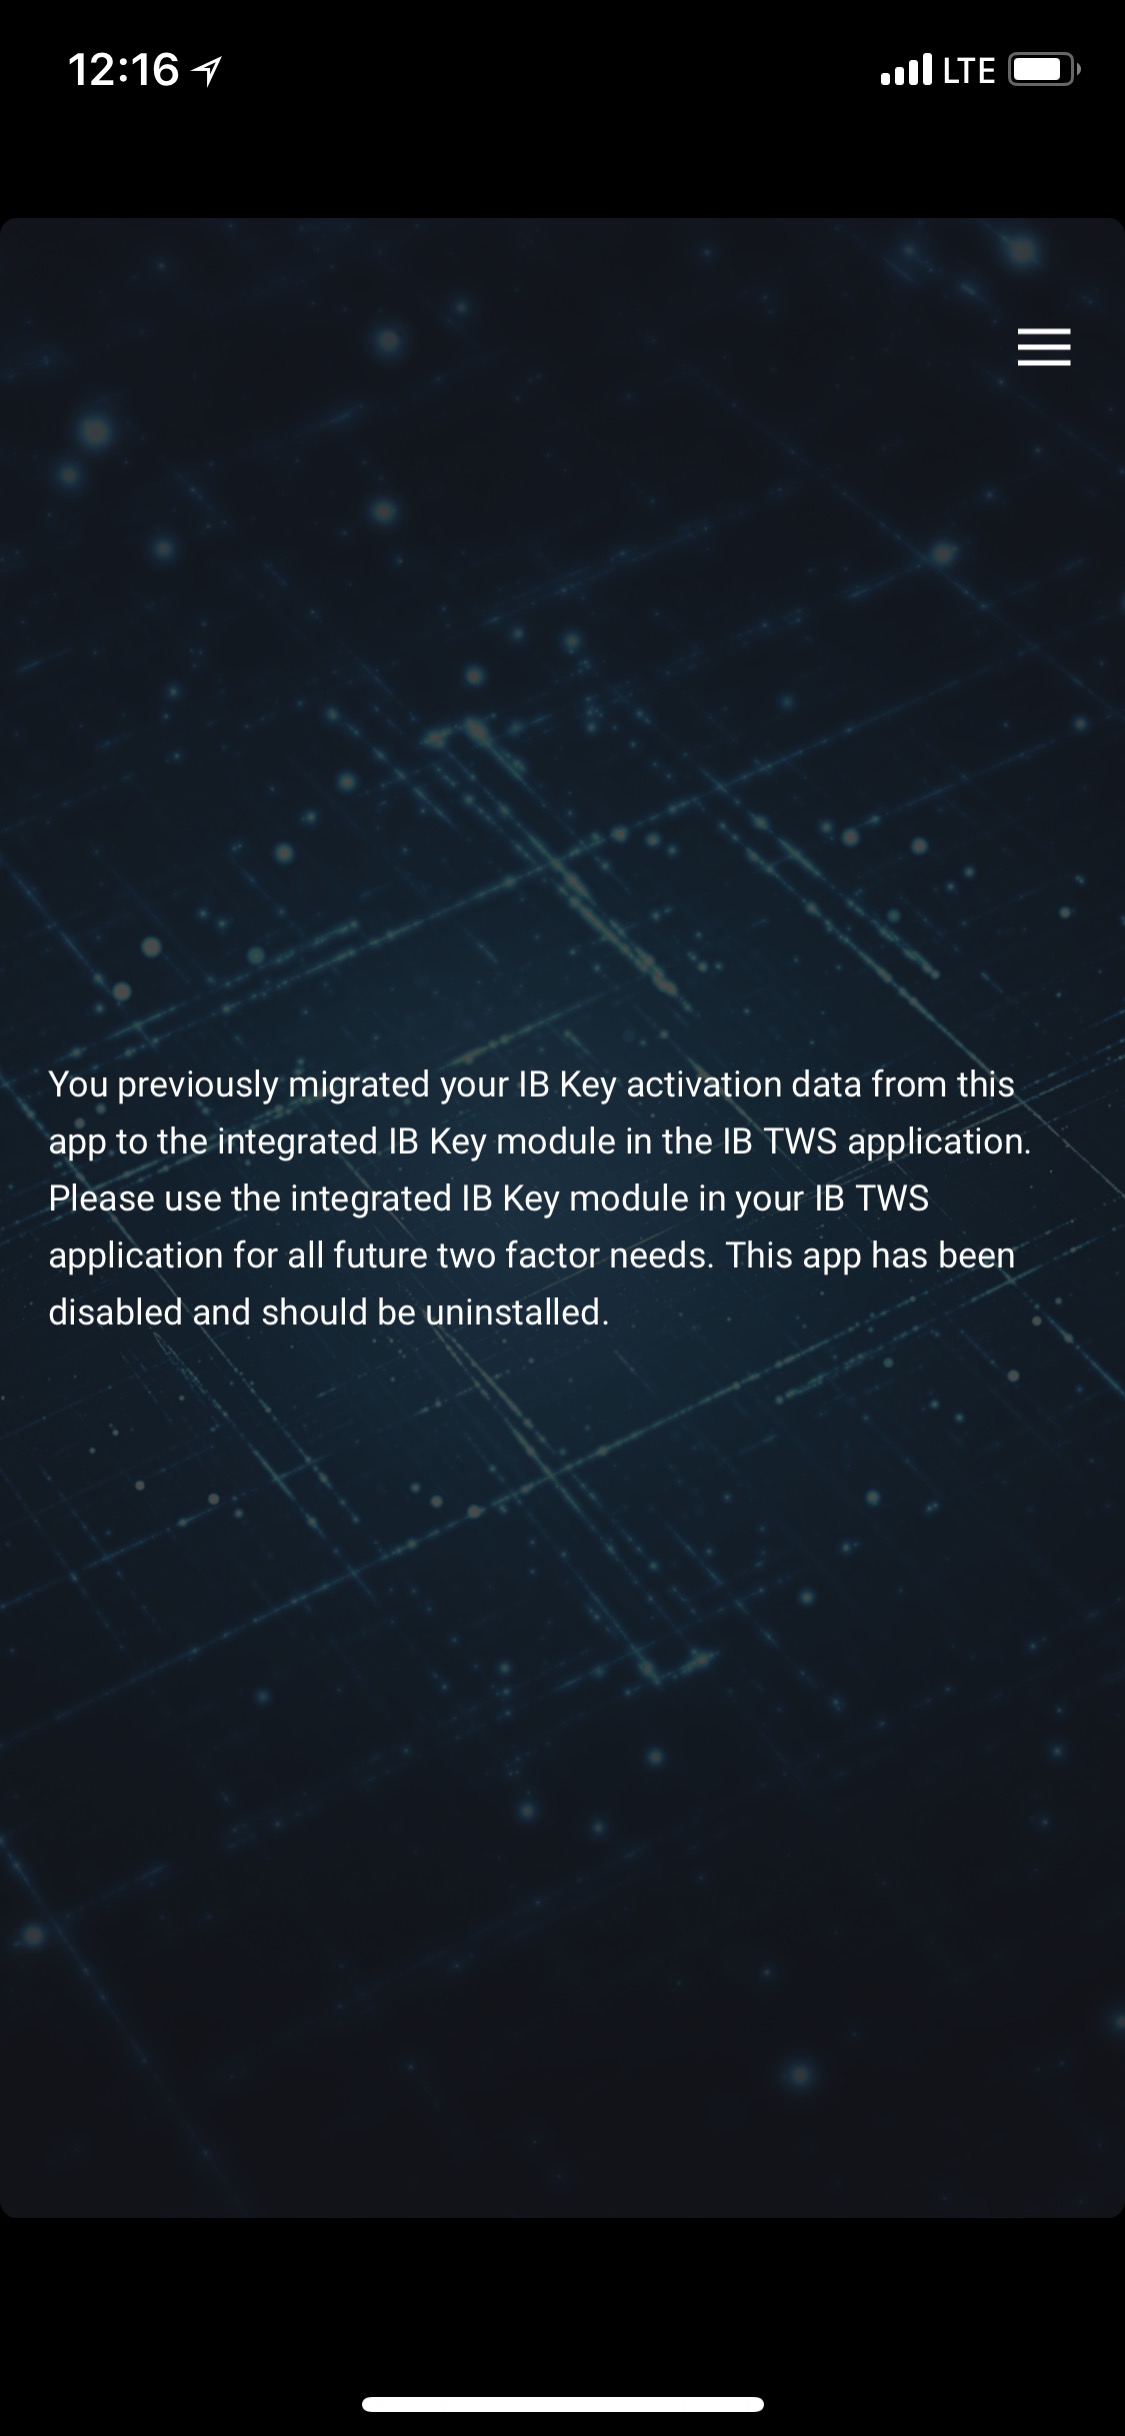
Abbildung 8
Tägliche Bedienung
A. Es ändert sich nichts am täglichen Loginablauf und falls Sie über eine Internetverbindung verfügen, läuft dies über das
nahtlose Authentifizierungsverfahren ab:
1. Geben Sie Ihre Anmeldedaten in die entsprechenden Felder ein (in der TWS, Kontoverwaltung, WebTrader oder
IBKR Mobile). Klicken Sie auf „Login”.
2. Das System wird Ihnen eine Benachrichtigung auf Ihren Smartphone-Bildschirm senden - tippen Sie darauf.
3. Je nachdem welches Gerät Sie verwenden, halten Sie Ihr Gesicht vor die Kamera bzw. Ihren Fingerabdruck auf den Sensor (iOS) oder
geben Sie Ihren PIN-Code ein (Android). Das System wird automatisch mit der Anmeldung fortfahren.
B. Falls Sie keine Internetverbindung haben, werden Sie IBKR Mobile im Prüfcode-Antwortcode-Modus verwenden müssen:
1. Geben Sie Ihre Logindaten in die entsprechenden Felder ein (in der TWS, Kontoverwaltung, WebTrader oder
IBKR Mobile). Klicken Sie auf „Login”.
2. Klicken Sie auf den Link, falls Sie keine Benachrichtigung erhalten haben.
3. Starten Sie IBKR Mobile und tippen Sie auf „Authentifizierung”.
4. Geben Sie im Feld „Prüfcode” Ihrer Smartphone-Anwendung die Zahlen ein, die auf dem Login-Bildschirm
angezeigt werden. Tippen Sie auf die Schaltfläche „Generieren”.
5. Geben Sie die von Ihrer Smartphone-App angezeigten Zahlen in das Antwortfeld an, die auf dem Login-Bildschirm
angezeigt werden. Klicken Sie auf „Login”.
Sie verwenden sowohl IB TWS als auch den IB Key
1. Bitte führen Sie zuerst die Aktivierung des Authentifizierungsmoduls der
IBKR-Mobile-App durch (Klicken Sie hier).
2. Melden Sie sich im Handelsbildschirm an, indem Sie auf die Schaltfläche „Handel” im Startbildschirm Ihrer neuen
IBKR-Mobile-App tippen (Klicken Sie hier).
Sie verwenden eine IB Debit Card
1. Bitte führen Sie zuerst die Aktivierung des Authentifizierungsmoduls der
IBKR-Mobile-App durch (Klicken Sie hier).
2. Tippen Sie auf dem Startbildschirm der IBKR-Mobile-App auf die Debit-Card-Schaltfläche. Die restlichen Anwendungsabläufe
sind identisch mit den Anwendungen, die Sie in der Vergangenheit genutzt haben.
How to overcome the "Downloading settings from server failed" error
Store settings on server allows clients the ability to store their Trader Workstation (TWS) settings/configuration on the cloud and retrieve them at anytime from another computer. This feature allows you to use the layout of a specific user on two or more machines.
In some specific circumstances, the operation which stores/downloads the settings to/from the cloud may fail and the following error message may appear shortly after the TWS has loaded on the screen:
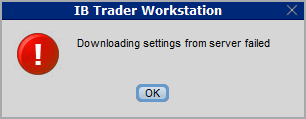
How to overcome this error message?
The underlying causes of this message are usually the following:
- ACCESS TO THE LOCAL MACHINE IS BLOCKED: A security setup, such as a firewall or antivirus, prevents the access of this computer to the cloud storage. This prevents TWS from accessing the remote server, thus disallowing the settings file upload or download. Recommended workaround: set up an exception on the firewall or antivirus in order to exclude the TWS executable file (c:\Jts\tws.exe) or the entire TWS folder (C:\Jts) from the real time security scan. The procedure to set an exclusion may vary, according to the software you are using, therefore we recommend consulting the user guide or the on-line documentation of your specific security program.
- ACCESS TO THE REMOTE SERVER IS BLOCKED: A firewall or proxy service blocks the communication with the cloud storage through the network on which this computer is. In this scenario, you (or your IT / Networking departments, in case you do not have the rights for such an operation) can modify the firewall or proxy settings to allow the computer to communicate with the cloud server s3.amazonaws.com on the TCP port 443. For additional details about the hosts/ports which needs to be allowed for the proper TWS operation, please see as well the section "DESKTOP TWS" of KB2816. Please refer to the documentation of your specific software in order to create specific rules for your firewall or proxy system.
Why is my chart delayed, showing question marks or only partially populated?
What are SMART Charts and how are they generated?
The SMART charting mechanism analyzes and compares the market data coming from all venues a given contract is traded on and graphically displays the most favorable quotes.
When all the data streams are live, the data points are available for all sources and for each time point, thus they can be fully compared. The resulting SMART chart will be up to date and fully populated, moreover it will constantly and automatically update1.
The comparison between non synchronized market data streams (some live and some delayed) is just partially possible, since the delayed feeds are lacking data points for the last 15 or 20 minutes. Therefore, within that time frame, the SMART chart will usually display a series of yellow question marks to indicate unavailability of source data. In this case the SMART Chart will not update automatically.
When the lack of data points is more extensive or when the Exchange does not distribute delayed data for a given contract, the correspondent SMART Chart may be completely blank.
What should I do to obtain a fully populated, up-to-date chart?
If your trading method is based on SMART charts, you would need to activate the live market data subscriptions for all the marketplaces your financial instruments are traded on2. For additional details, please see KB1201
If your trading method does not require SMART charts, you can decide to use Direct chart routing as a workaround.
A Directed Chart will allow you to graphically represent the market data coming from a single, specific Exchange. When possible, we suggest to select the primary marketplace for the product for this purpose, since this is usually the one offering the highest liquidity and trade volume, hence normally providing the most favorable quotes. If you have subscribed the market data for that venue, the resulting Directed Chart will be fully populated, up to date and it will update automatically1.
How do I set up a Directed Chart?
1. Within a watchlist, type the contract symbol and press Enter on your keyboard.

2. When then contract selection menu appears, select the item Stock (Directed). If you do not see this item, click on the small down arrow at the bottom of the menu to reveal the hidden menu items.
.png)
3. The Exchange selection screen will appear. You can now select the main Exchange for the product or the Exchange for which you have an active live market data subscription. Once done, click OK.

4. Within your watchlist you will see a newly created Directed Ticker line. It will contain the contract symbol and, preceded by the @ sign, the Exchange you selected at the previous step. Right click on that directed ticker line and select Chart > New Chart


Delayed Market Data Timing
Market data vendors typically offer exchange data in two categories, real-time and delayed. Real-time market data is disseminated as soon as the information is publicly available. Delayed market data is on a time lag that is usually 10-20 minutes behind real-time quotes.
Some exchanges allow delayed data to be displayed without any market data subscription, free of charge. A list of the exchanges we provide delayed data for at no cost and without formal request (i.e., the delayed data will be displayed upon entry of the product symbol on the trading platform) are outlined in the table below. The table also includes the corresponding real-time subscription, the fees for which are posted on IBKR's public website.
Please Note:
- In accordance with regulatory requirements, IBKR no longer offers delayed quotation information on U.S. equities to Interactive Brokers LLC clients.
- Delayed quotes should be used for indicative purposes and not necessarily for trading. The times mentioned may be subject to further delays without notice.
The Americas
| External Exchange Name | IB Exchange Name | Delay Period | Real Time Subscription |
| CBOT | CBOT | 10 minutes | CBOT Real-Time |
| CBOE Futures Exchange | CFE | 10 minutes | CFE Enhanced |
| Market Data Express (MDX) | CBOE | 10 minutes | CBOE Market Data Express Indices |
| CME | CME | 10 minutes | CME Real-Time |
| COMEX | COMEX | 10 minutes | COMEX Real-Time |
| ICE US | NYBOT | 10 minutes | ICE Futures U.S. (NYBOT) |
| Mexican Derivatives Exchange | MEXDER | 15 minutes | Mexican Derivatives Exchange |
| Mexican Stock Exchange | MEXI | 20 minutes | Mexican Stock Exchange |
| Montreal Exchange | CDE | 15 minutes | Montreal Exchange |
| NYMEX | NYMEX | 10 minutes | NYMEX Real-Time |
| NYSE GIF | NYSE | 15 minutes | NYSE Global Index Feed |
| One Chicago | ONE | 10 minutes | OneChicago |
| OPRA | OPRA | 15 minutes | OPRA Top of Book (L1) (US Option Exchanges) |
| OTC Markets | PINK | 15 minutes | OTC Markets |
| Toronto Stock Exchange | TSE | 15 minutes | Toronto Stock Exchange |
| Venture Exchange | VENTURE | 15 minutes | TSX Venture Exchange |
Europe
| External Exchange Name | IB Exchange Name | Delay Period | Real Time Subscription |
| BATS Europe | BATE/CHIX | 15 minutes | European (BATS/Chi-X) Equities |
| Boerse Stuttgart | SWB | 15 minutes | Stuttgart Boerse incl. Euwax (SWB) |
| Bolsa de Madrid | BM | 15 minutes | Bolsa de Madrid |
| Borsa Italiana | BVME/IDEM | 15 minutes | Borsa Italiana (BVME stock / SEDEX / IDEM deriv) |
| Budapest Stock Exchange | BUX | 15 minutes | Budapest Stock Exchange |
| Eurex | EUREX | 15 minutes | Eurex Real-Time Information |
| Euronext | AEB/SBF/MATIF/BELFOX | 15 minutes | Euronext Cash |
| Euronext | AEB/SBF/MATIF/BELFOX | 15 minutes | Euronext Data Bundle |
| Frankfurt Stock Exchange and XETRA | FWB/IBIS/XETRA | 15 minutes | Spot Market Germany (Frankfurt/Xetra) |
| ICE Futures Europe (Commodities) | IPE | 10 minutes | ICE Futures E.U. - Commodities (IPE) |
| ICE Futures Europe (Financials) | ICEEU | 10 minutes | ICE Futures E.U. – Financials (LIFFE) |
| LSE | LSE | 15 minutes | LSE UK |
| LSEIOB | LSEIOB | 15 minutes | LSE International |
| MEFF | MEFF | 15 minutes | BME (MEFF) |
| NASDAQ OMX Nordic Derivatives | OMS | 15 minutes | Nordic Derivatives |
| Prague Stock Exchange | PRA | 15 minutes | Prague Stock Exchange Cash Market |
| SWISS Exchange | EBS/VIRTX | 15 minutes | SIX Swiss Exchange |
| Tel Aviv Stock Exchange | TASE | 15 minutes | Tel Aviv Stock Exchange |
| Turquoise ECN | TRQXCH/TRQXDE/TRQXEN | 15 minutes | Turquoise ECNs |
| Warsaw Stock Exchange | WSE | 15 minutes | Warsaw Stock Exchange |
Asia
| External Exchange Name | IB Exchange Name | Delay Period | Real Time Subscription |
| Australian Stock Exchange | ASX | 20 minutes | ASX Total |
| Hang Seng Indices | HKFE-IND | 15 minutes | Hang Seng Indexes |
| Hong Kong Futures Exchange | HKFE | 15 minutes | Hong Kong Derivatives (Fut & Opt) |
| Hong Kong Stock Exchange | SEHK | 15 minutes | Hong Kong Securities Exchange (Stocks, Warrants & Bonds) |
| Korea Stock Exchange | KSE | 20 minutes | Korea Stock Exchange |
| National Stock Exchange of India | NSE | 15 minutes | National Stock Exchange of India, Capital Market Segment |
| Osaka Securities Exchange | OSE.JPN | 20 minutes | Osaka Exchange |
| SGX Derivatives | SGX | 10 minutes | Singapore Exchange (SGX) - Derivatives |
| Shanghai Stock Exchange | SEHKNTL | 15 minutes | Shanghai Stock Exchange |
| Shanghai Stock Exchange STAR Market | SEHKSTAR | 15 minutes | Shanghai Stock Exchange |
| Shenzhen Stock Exchange | SEHKSZSE | 15 minutes | Shenzhen Stock Exchange |
| Singapore Stock Exchange | SGX | 10 minutes | Singapore Exchange (SGX) - Stocks |
| Australia Securities Exchange | ASX24 | 10 minutes | ASX24 Commodities and Futures |
| Taiwan Stock Exchange | TWSE | 20 minutes | Taiwan Stock Exchange |
| Tokyo Stock Exchange | TSEJ | 20 minutes | Tokyo Stock Exchange |
Risk Navigator: Alternative Margin Calculator
IB routinely reviews margin levels and will implement changes which serve to increase requirements above statutory minimums as market conditions warrant. To assist clients with understanding the effects of such changes on their portfolio, a feature referred to as the "Alternative Margin Calculator" is provided within the Risk Navigator application. Outlined below are the steps for creating a “what-if” portfolio for the purpose of determining the impact of such margin changes.
Step 1: Open a new “What-if” portfolio
From the Classic TWS trading platform, select the Analytical Tools, Risk Navigator, and then Open New What-If menu options (Exhibit1).
Exhibit 1
.png)
From the Mosaic TWS trading platform, select New Window, Risk Navigator, and then Open New What-If menu options.
Step 2: Define starting portfolio
A pop-up window will appear (Exhibit 2) from which you will be prompted to define whether you would like to create a hypothetical portfolio starting from your current portfolio or a newly created portfolio. Clicking on the "yes" button will serve to download existing positions to the new “What-If” portfolio.
Exhibit 2

Clicking on the "No" button will open up the “What – If” Portfolio with no positions.
Risk Dashboard
The Risk Dashboard is pinned along the top of the product tab-sets, and is and is available for what-if as well as active portfolios. The values are calculated on demand for what-if portfolios. The dashboard provides at-a-glance account information including:
1) Net Liquidation Value: The total Net Liquidation Value for the account
2) P&L: The total daily P&L for the entire portfolio
3) Maintenance Margin: Total current maintenance margin
4) Initial Margin: Total initial margin requirements
5) VAR: Shows the Value at risk for the entire portfolio
6) Expected Shortfall (ES): Expected Shortfall (average value at risk) is expected return of the portfolio in the worst case

Alternative Margin Calculator
The Alternative Margin Calculator, accessed from the Margin menu and clicking on the Margin Mode (Exhibit 3), shows how the margin change will affect the overall margin requirement, once fully implemented.
Exhibit 3

Step 3: Selecting Margin Mode Settings
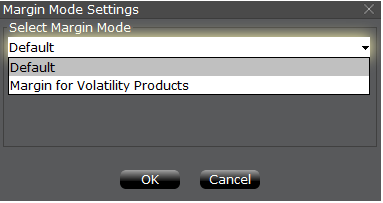
A pop-up window will appear (Exhibit 4) entitled Margin Mode Setting. You can use the drop-down menu in that window to change the margin calculations from Default (being the current policy) to the new title of the new Margin Setting (being the new margin policy). Once you have made a selection click on the OK button in that window.
Exhibit 4
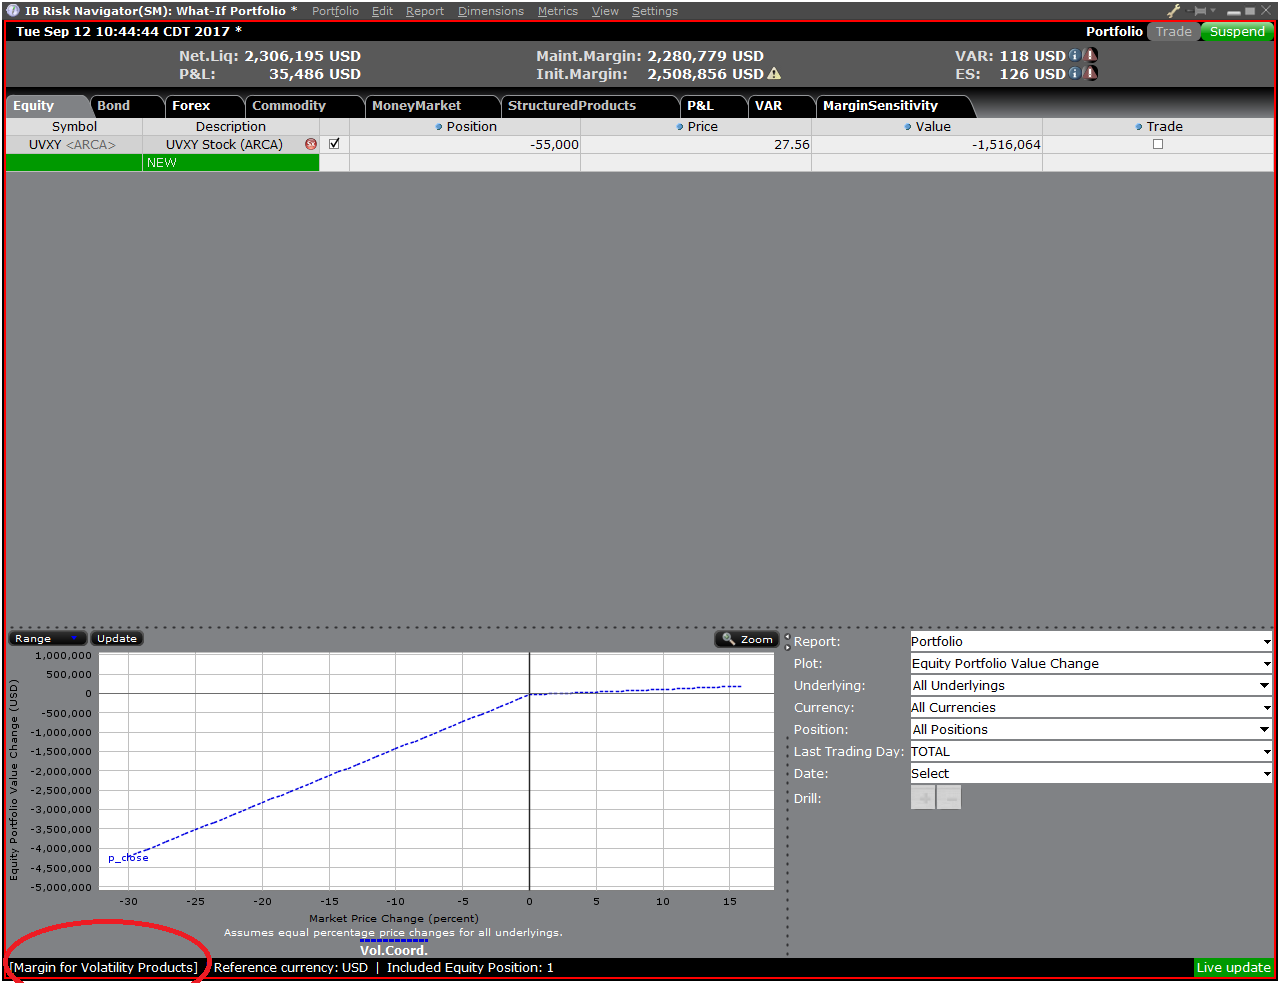
Once the new margin mode setting is specified, the Risk Navigator Dashboard will automatically update to reflect your choice. You can toggle back and forth between the Margin Mode settings. Note that the current Margin Mode will be shown in the lower left hand corner of the Risk Navigator window (Exhibit 5).
Exhibit 5
Step 4: Add Positions
To add a position to the "What - If" portfolio, click on the green row titled "New" and then enter the underlying symbol (Exhibit 6), define the product type (Exhibit 7) and enter position quantity (Exhibit 8)
Exhibit 6

Exhibit 7

Exhibit 8

You can modify the positions to see how that changes the margin. After you altered your positions you will need to click on the recalculate icon (![]() ) to the right of the margin numbers in order to have them update. Whenever that icon is present the margin numbers are not up-to-date with the content of the What-If Portfolio.
) to the right of the margin numbers in order to have them update. Whenever that icon is present the margin numbers are not up-to-date with the content of the What-If Portfolio.
20-Minute Reconnect Grace Period, Unless Fingerprint/PIN Device Lock is Enabled
We recently introduced 30-hour Extended Trading access for mobile users (see the Android or iOS release notes).

