Why is my chart delayed, showing question marks or only partially populated?
Background:
What are SMART Charts and how are they generated?
The SMART charting mechanism analyzes and compares the market data coming from all venues a given contract is traded on and graphically displays the most favorable quotes.
When all the data streams are live, the data points are available for all sources and for each time point, thus they can be fully compared. The resulting SMART chart will be up to date and fully populated, moreover it will constantly and automatically update1.
The comparison between non synchronized market data streams (some live and some delayed) is just partially possible, since the delayed feeds are lacking data points for the last 15 or 20 minutes. Therefore, within that time frame, the SMART chart will usually display a series of yellow question marks to indicate unavailability of source data. In this case the SMART Chart will not update automatically.
When the lack of data points is more extensive or when the Exchange does not distribute delayed data for a given contract, the correspondent SMART Chart may be completely blank.
What should I do to obtain a fully populated, up-to-date chart?
If your trading method is based on SMART charts, you would need to activate the live market data subscriptions for all the marketplaces your financial instruments are traded on2. For additional details, please see KB1201
If your trading method does not require SMART charts, you can decide to use Direct chart routing as a workaround.
A Directed Chart will allow you to graphically represent the market data coming from a single, specific Exchange. When possible, we suggest to select the primary marketplace for the product for this purpose, since this is usually the one offering the highest liquidity and trade volume, hence normally providing the most favorable quotes. If you have subscribed the market data for that venue, the resulting Directed Chart will be fully populated, up to date and it will update automatically1.
How do I set up a Directed Chart?
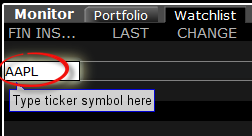
1. Within a watchlist, type the contract symbol and press Enter on your keyboard.
2. When then contract selection menu appears, select the item Stock (Directed). If you do not see this item, click on the small down arrow at the bottom of the menu to reveal the hidden menu items.
.png)
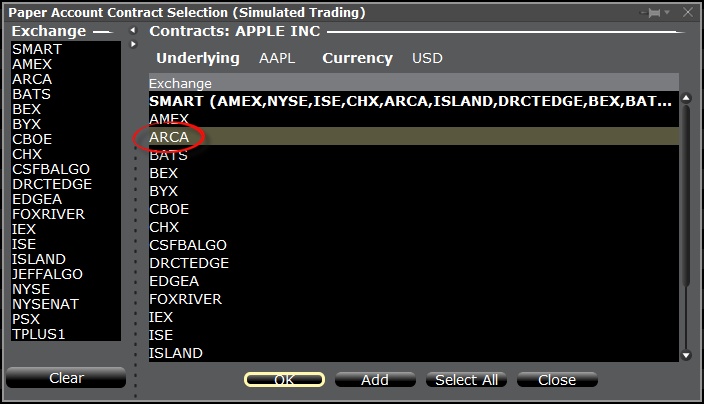
3. The Exchange selection screen will appear. You can now select the main Exchange for the product or the Exchange for which you have an active live market data subscription. Once done, click OK.
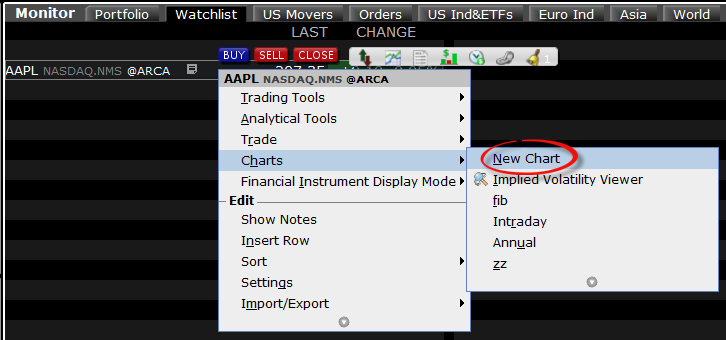
4. Within your watchlist you will see a newly created Directed Ticker line. It will contain the contract symbol and, preceded by the @ sign, the Exchange you selected at the previous step. Right click on that directed ticker line and select Chart > New Chart
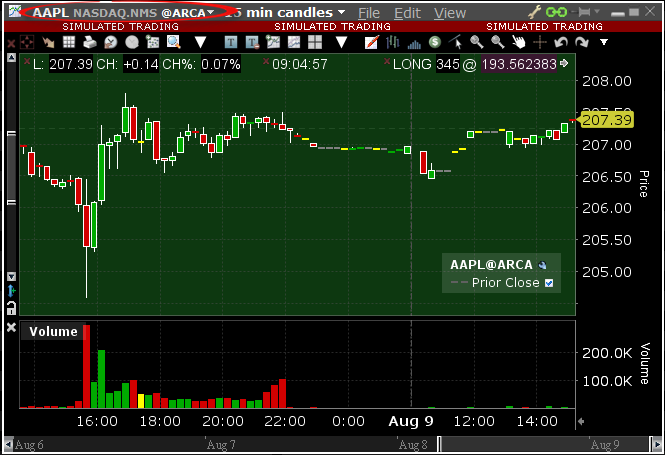
5. The chart will be shown. On the left side of the toolbar, after the contract symbol, you will see the Exchange you selected preceeded by a @ sign, indicating that this is a Directed Chart.
1. In order for the chart to update automatically, the checkbox "Keep chart up to date" has to be activated in the Chart Parameters panel. The panel is reachable directly within the chart window, from the top menu Edit.
2. Alternative streaming quotes for EU equities are available to clients with non-professional or non-commercial market data subscriber status. The complimentary real-time streaming Best Bid and Offer and last sale quotes on European Equities will be aggregated from exchanges such as Cboe Europe, Gettex, Tradegate and Turquoise. The data will display in the SMART quote line and can be used to generate a chart as well. Users who would like to receive the full EBBO (European Best Bid and Offer) will need to subscribe to the individual exchange subscriptions.
Berichte zur Berechnung der Risikogebühr
EINFÜHRUNG
Unser Kontoverwaltungssystem lässt Sie Ihr Konto von einem einzigen Fenster aus konfigurieren und verwalten, einschließlich unserem Bericht zur Berechnung der Risikogebühr. Die Berechnung der Risikogebühr wird täglich durchgeführt und ist in der Kontoverwaltung einsehbar, bevor die US-Aktienmärkte öffnen. Dieser Bericht ermöglicht Benutzern Veränderungen im Gewinn und Verlust (G&V) Ihrer Positionen einzusehen, falls der Kurs jeder Ihrer Positionen nach vordefinierten Prozentsätzen fällt und steigt.
ZUGRIFF AUF DEN BERICHT
Auf diese Weise können Sie auf den Bericht zur Berechnung der Risikogebühr zugreifen bzw. einen generieren
1) Klicken Sie von der Startseite der Kontoverwaltung aus auf „Berichte” und danach auf „Andere Berichte”. 
2) Der folgende Bildschirm erscheint.
3) Wählen Sie „Berechnung der Risikogebühr” aus dem Drop-down-Menü im Abschnitt „Berichte” aus. Danach erscheinen die Einstellungen zur Berechnung der Risikogebühr
4) Wählen Sie im Feld „Datum” das Datum für den Bericht aus
5) Klicken Sie auf „Bericht erstellen”
BERICHTÜBERSICHT
Die Risikogebührübersichten stellen das durchschnittliche Risikopotenzial, die entsprechende Risikogebühr für jede Branche1 und einen Link zu unserem Empfindlichkeitsbericht zur korrelierten Risikogebühr zur Verfügung.
Detaillierte Branchenübersicht
Wenn Sie auf den mit jeder Branche verbundenen Link klicken,1 erscheint eine detaillierte Übersicht, die es Benutzern ermöglicht, Veränderungen im G&V Ihrer Positionen zu sehen, falls der Kurs des dazugehörigen ETFs/Indizes um einen vordefinierten Prozentsatz fällt/steigt. Im Fall von Aktien und Indizes nehmen wir zum Beispiel an, dass SPX um 30%, 20% und 10% fällt und dass unabhängige um 10% und 20% steigen. Die Ergebnisse basieren auf theoretischen Kursmodellen und berücksichtigen zufällige Veränderungen in der Volatilität sowie anderen Variablen, die Einfluss auf Derivatkurse nehmen.
Der Bericht gibt Folgendes an:
- Nettoliquidierungswert (NLV) Ihres Kontos basierend auf Positionen zum Handelsschluss des vorherigen Tages
- Durchschnittliches Risikopotenzial für den Sektor
- Entsprechende Risikogebühr
- Kapital aller Positionen im Konto mit G&V in der Basiswährung
Klicken Sie auf das Optionsfeld entsprechend der steigenden oder fallenden Kursveränderungen, die Sie sehen möchten (+/- 10%, 20% oder +30%), um den Bericht zu verwenden. Der G&V für jede Position wird entsprechend dem ausgewählten Prozentsatz aktualisiert
Die folgenden Zahlen dienen als Beispiel für eine detaillierte Übersicht zum Aktiensektor, wobei -30% ausgewählt wurde
1 Konten können über ein durchschnittliches Risikopotenzial und eine entsprechende Risikogebühr für mehr als einen Sektor verfügen
Empfindlichkeitsbericht für die korrelierte Risikogebühr
Für jeden Kontrakt im Portfolio ermitteln wir eine Schätzung der Risikogebühr, falls die Position eines einzelnen Kontraktes geändert wird. Wir nehmen dabei an, dass Kontrakte entweder gekauft oder verkauft werden, anstatt dass sie eingehend/abgehend übertragen werden. Die Positionsveränderung kann nicht geändert werden und in manchen Fällen ist es erforderlich, dass das Konto die Richtung seiner Positionen umkehren muss, z. B. von einer Short-Position zu einer Long-Position.
Für zusätzliche Informationen zur Risikogebühr, siehe KB3114
Exposure Fee Calculation Reports
INTRODUCTION
Our Account Management system lets you configure and manage your account from a single window, including our Exposure Fee Calculations report. The Exposure Fee Calculations is generated daily and made available within Account Management prior to the U.S. equity market open. This report allows users to view the change in Profit and Loss (PnL) of your positions if the price of each of your positions declines and increases by predetermined percentages.
REPORT ACCESS
To access/generate an Exposure Fee Calculations Report
1) From the Account Management Home Page, click on the Reports and then Other Reports menu options.
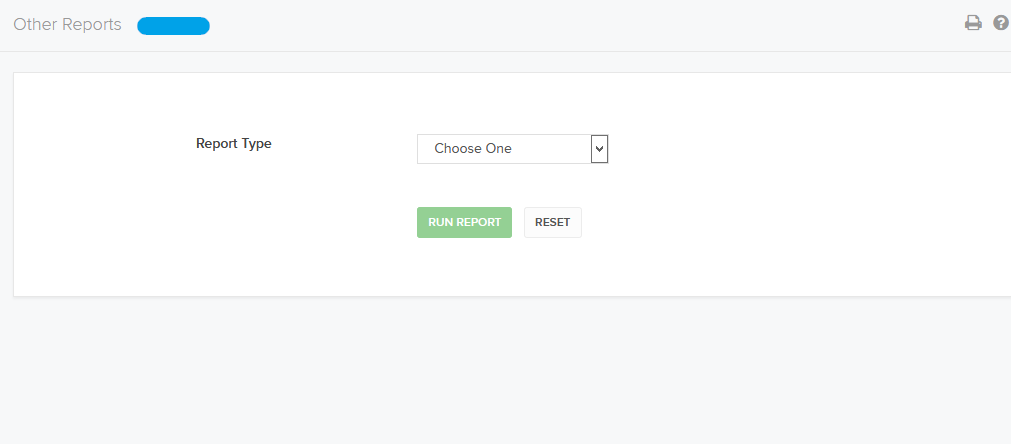
2) The following screen will appear.
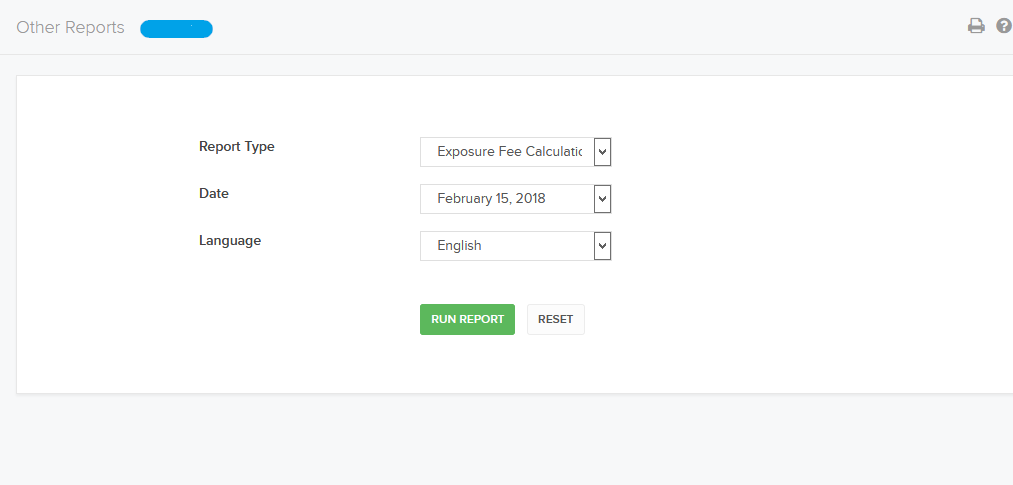
3) Select Exposure Fee Calculations from the Report Type drop-down. Exposure Fee Calculations settings appear
4) In the Date field,select the date for the report
5) Click Run Report
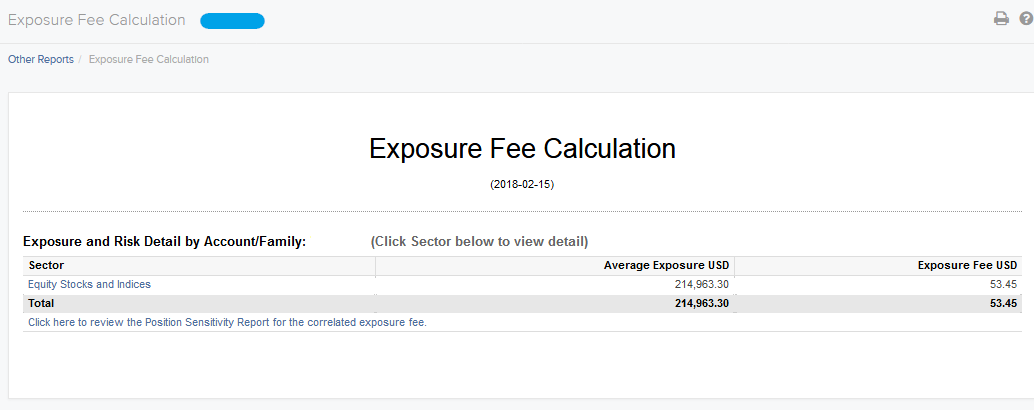
REPORT OVERVIEW
The Exposure Fee Summary Reports reflects the Average Exposure and the corresponding Exposure Fee for each Sector1 and a hyper-link to view our Sensitivity Report for the Correlated Exposure Fee
Detailed Sector Summary
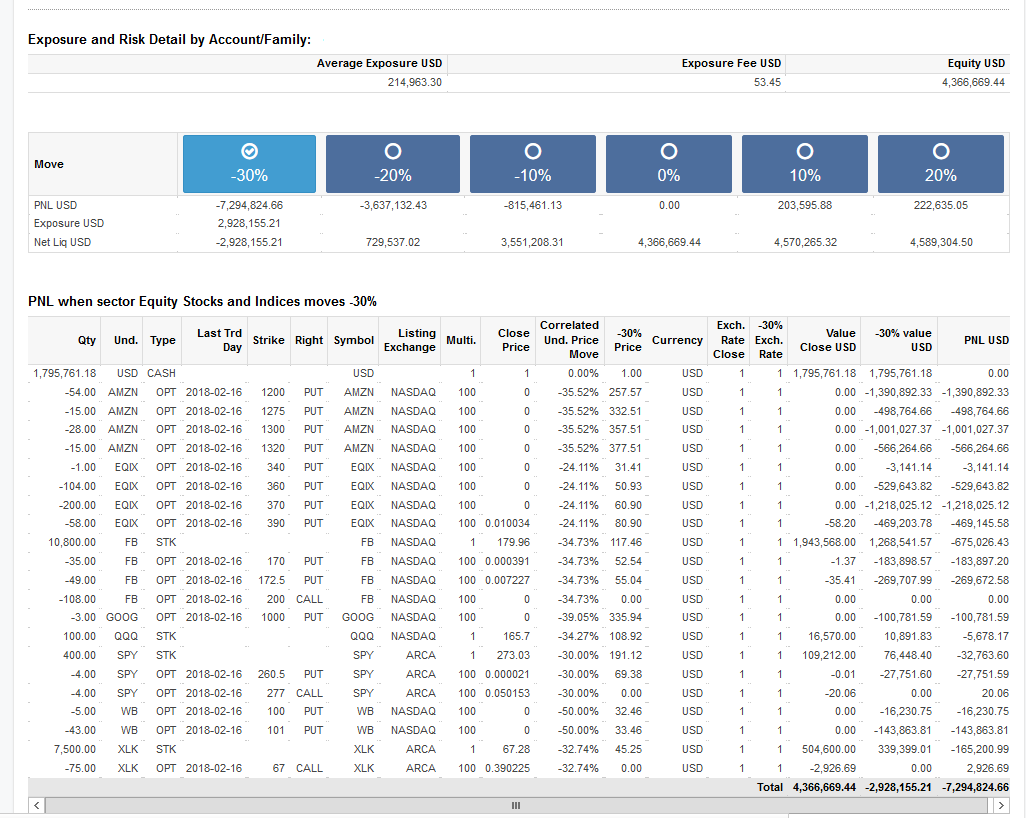
Clicking on the hyper-link associated with each sector1 will populate a detailed summary, which allows users to see the change in the PNL of your positions if the price of the corresponding ETF/Index increases / declines by a pre-determined amount. For the example of Equity Stocks and Indices we are assuming SPX declines by 30%, 20% and 10% and independent increases by 10% and 20% The results are based on theoretical pricing models and take into account coincidental changes in volatility and other variables that affect derivative prices
The report shows:
- The Net Liquidation Value (NLV) of your account based on positions from the previous day’s close
- Average Exposure for the sector
- Corresponding Exposure Fee
- Equity of all positions in the account with PNL in base currency
To use the report, click the radio button that corresponds to the up or down price change you want to see (+/- 10%, 20% or +30%). The PNL for each position is updated by the selected percentage
The following are figure shows an example of a Detailed Summary of the Equity Sector, with -30% selected
1 Accounts may have Average Exposure and a corresponded Exposure Fee for more than 1 Sector
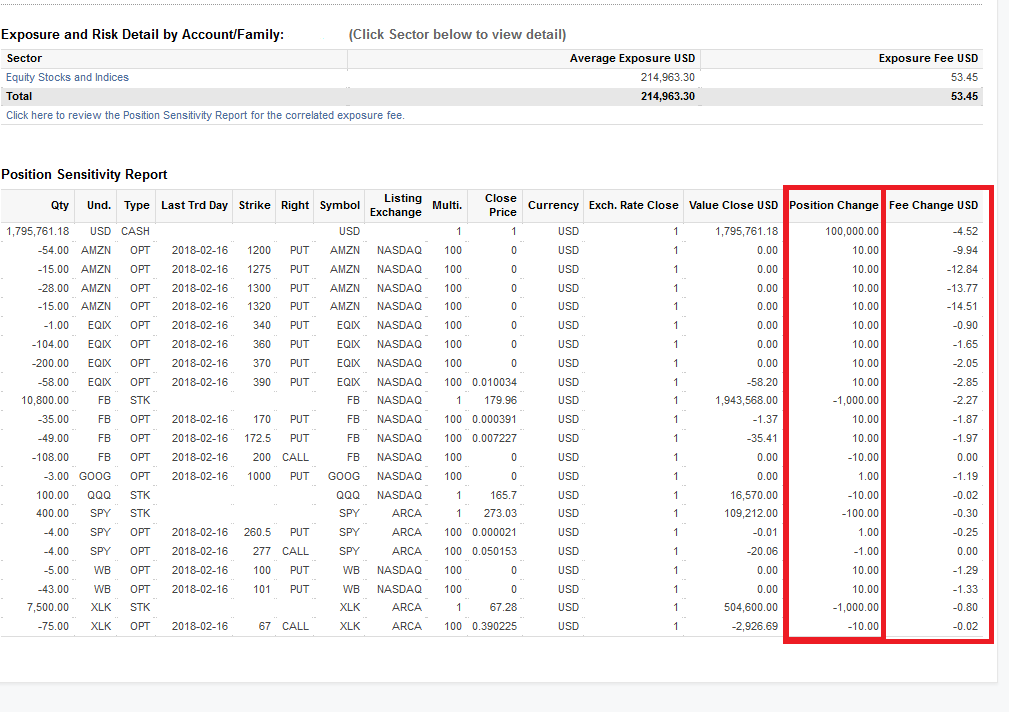
Sensitivity Report for the Correlated Exposure Fee
For every contract in the portfolio we compute an estimate of the exposure fee if the position of a single contract is modified. We assume that contracts are bought or sold, as opposed to transferred in/out. The position change is not editable and in some cases may actually require the account to reverse the direction of their position, for example from a short position to long position.
For additional information regarding the Exposure Fee, please see KB3114
Cryptocurrency Products Offered by IBKR
Übersicht:
Below is a list of many of the Cryptocurrency products offered by IBKR*. If you don't see the product you are looking for, you can search the IBKR contract database through the Contract Search tool available on our website. Select the Support menu followed by your account type (Individual or Institution). Here you can do a Simple search by entering the product name or symbol, an Advanced search which allows you add filters to the search, or a search by specific product type.
Cryptocurrency
- BTC- Bitcoin
- ETH- Ethereum
- LTC- Litecoin
- BCH- Bitcoin Cash
Stocks/ETFs
US
- GBTC (PINK)- Grayscale Bitcoin Investment Trust
- BCHG (PINK)- Grayscale Bitcoin Cash Trust
- ETCG (PINK)- Grayscale Ethereum Classic Trust
- ETHE (PINK)- Grayscale Ethereum Trust
- GDLC (PINK)- Grayscale Digital Large Cap Fund
- LTCN (PINK)- Grayscale Litecoin Trust
Non-US
- BITCOINXB (SFB)- Bitcoin Tracker One
- COINETH (SFB)- XBT Provider Ethereum
- COINETHE (SFB)- XBT Provider Ethereum
Indices
- NYXBT (NYSE)- NYSE Bitcoin Index
- GXBT (Cboe)- The Gemini Bitcoin Trace Price Index (No new contracts offered for trading as of June 2019)
- BRR (CME)- CME Bitcoin Reference Rate Index
- BRTI (CME)- CME Bitcoin Real Time Index
Futures
- GXBT (Cboe/CFE)- The Gemini Bitcoin Trace Price Futures (No new contracts offered for trading as of June 2019)
- BRR (CME)- CME Bitcoin Reference Rate Futures
- ETHUSDRR (CME) – CME Ether Dollar Reference Rate Futures
- BAKKT (ICECRYPTO)- Bakkt Bitcoin Futures
*Some or all of the above products may not be available to IBKR clients located in certain jurisdictions.
Back to Table of Contents: Bitcoin and Other Cryptocurrency Products @ IBKR
Bitcoin and Other Cryptocurrency Products @ IBKR
Cryptocurrency Products Offered by IBKR
Cryptocurrency Products Market Data
Trading Bitcoin Futures with IBKR
Bitcoin Futures Product Page
https://www.interactivebrokers.com/en/index.php?f=25379
IBKR Margin Requirements
https://www.interactivebrokers.com/en/index.php?f=24176
How to update the US Social Security Number (SSN) or Individual Taxpayer Identification Number (ITIN) on your account
Background:
If you have been informed or believe that your account profile contains an incorrect US SSN/ITIN, you may simply log into your Account Management to update this information. Depending on your taxpayer status, you can update your US SSN/ITIN by modifying one of the following documents:
1) IRS Form W9 (if you are a US tax resident and/or US citizen holding a US SSN/ITIN)
2) IRS Form W-8BEN (if you are a Non-US tax resident holding a US SSN/ITIN)
Please note, if your SSN/ITIN has already been verified with the IRS you will be unable to update the information. If however the IRS has not yet verified the ID, you will have the ability to update through Account Management.
How to Modify Your W9/W8
1) To submit this information change request, first login to Account Management
2) Click on the Settings section followed by Account Settings
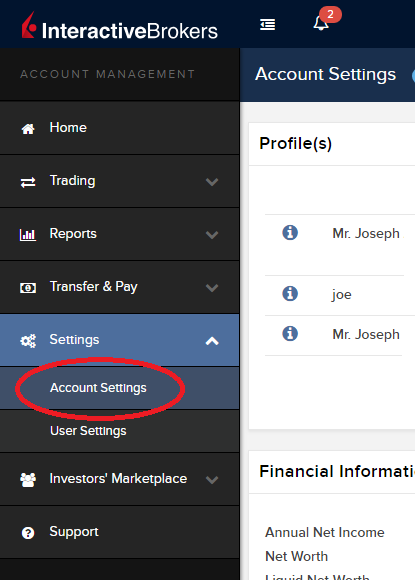
3) Find the Profile(s) section. Locate the User you wish to update and click on the Info button (the "i" icon) to the left of the User's name
.png)
4) Scroll down to the bottom where you will see the words Tax Forms. Next to it will be a link with the current tax form we have for the account. Click on this tax form to open it
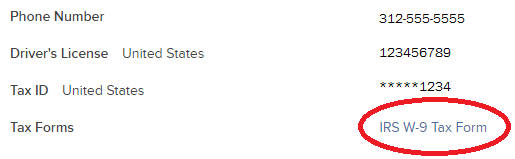
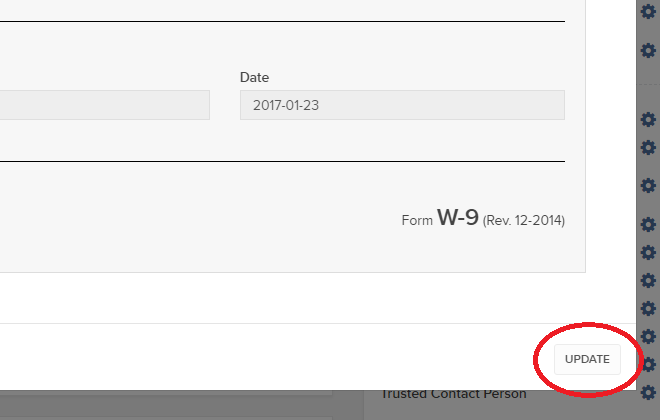
5) Review the form. If your US SSN/ITIN is incorrect, click on the UPDATE button at the bottom of the page
6) Make the requisite changes and click the CONTINUE button to submit your request.

7) If supporting documentation is required to approve your information change request, you will receive a message. Otherwise, your information change request should be approved within 24-48 hours.
How to adjust font size in TWS
Background:
By default, Trader Workstation (TWS) is designed to display in a font size and style which can be read comfortably for the average user across various screen sizes and resolutions. With the advent of new technologies, there has been an exponential push to make monitors with higher display sizes and your layout may need to be further adjusted manually. This document serves to explain how to manually adjust the font size for TWS.
Procedure
To adjust font size throughout TWS:
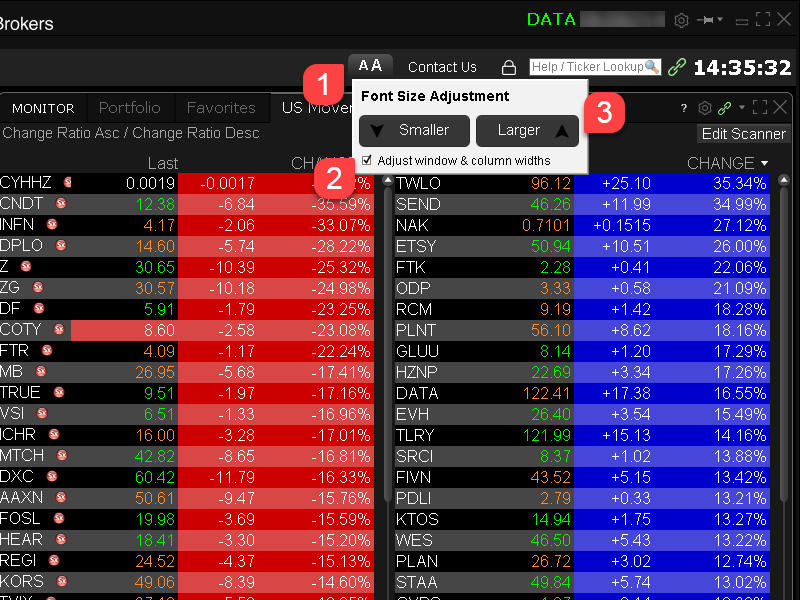
- From the Anchor window, click the Font Size Adjustment icon.

- Check the button Adjust window & column widths to ensure all windows will resize automatically to keep the same font:window ratio. (If unchecked, only font size will change but window size will remain the same).
- Click the button Smaller or Larger until the font size is correct.
Notice that the font size will change immediately as you click the button. - Click the Font Size Adjustment icon when done.
Note: It is possible that currently not all windows will be adjusted in the same way.
How to check and solve connectivity issues affecting the Trader Workstation (TWS)
Background:
The Trader Workstation (TWS) software needs to connect to our gateways and market data servers in order to work properly. Connectivity issues affecting your local network or your Internet Service Provider network may negatively affect the TWS functionality. In this article we will indicate how to test your connectivity using an automated connectivity test web page.
How to test the connectivity using the automated "IB Connectivity Test" web page?
1) Launch the Firefox browser and open this link with that browser: http://www.interactivebrokers.com/cgi-bin/conn_test.pl
Note: due to browser specific constraints, the above connectivity test link will only produce consistent results on the Mozilla Firefox browser. If you do not have Firefox, you can download and install it form here.
2) Please wait until all the tests have been completed and results have been displayed. If you see "Success" as outcome for all tests, your connectivity to IB Servers is reliable at the present moment. No additional connectivity troubleshooting or configuration should be needed.
3) If you see "Fail" as outcome for one or more test/s, please click on the link "Fail" itself in order to display the "IB Network Troubleshooting Guide". That section will help you conduct some manual tests to identify the cause of the failure.
Note for Corporative environments and Proxy server users: the automated "Connectivity Test" page may return misleading results in case your machine is accessing the Internet through a Proxy server. This usually happens if you are connected to a company network. If this is your case, we kindly ask you to contact your Network Administrator or your IT Team and ask them to perform a manual connectivity tests towards the destination servers indicated in the table on the top of the IB automated "Connectivity Test" web page itself. The manual connectivity test should be conducted using destination TCP ports 4000 and 4001. Should they prefer to have the server list in another format or should they need to set up the firewall / IP Management rules, you can forward them this page.
Willkommen bei Interactive Brokers
Übersicht:
Ihr Konto ist nun mit Einlagen ausgestattet und bestätigt - das heißt, Sie können beginnen zu handeln. Die nachfolgenden Informationen werden Ihnen den Start als Neukunde bei Interactive Brokers erleichtern.
- Ihr Vermögen
- Konfigurieren Sie Ihr Konto für den Handel
- So funktioniert der Handel
- Handel in aller Welt
- Fünf Punkte zur Optimierung Ihres IB-Kundenerlebnisses
1. Ihr Vermögen
Allgemeine Informationen zu Einzahlungen und Auszahlungen/Abhebungen. Alle Transaktionen werden über Ihr sicheres Kontoverwaltungssystem abgewickelt.
Einzahlungen
Zunächst müssen Sie eine Einzahlungsbenachrichtigung erstellen. Nutzen Sie hierzu folgenden Navigationspfad: Kontoverwaltung > Guthabenverwaltung > Guthabentransfers > Transaktionstyp: „Einzahlung“. Hier erfahren Sie, wie Sie eine Einzahlungsbenachrichtigung erstellen. Der zweite Schritt besteht darin, dass Sie Ihre Bank beauftragen, die Banküberweisung unter Verwendung der Bankverbindung, die Ihnen im Zuge der Erstellung der Einzahlungsbenachrichtigung mitgeteilt wird, auszuführen.
Auszahlungen/Abhebungen
Erstellen Sie eine Auszahlungsanweisung. Nutzen Sie hierzu folgenden Navigationspfad: Kontoverwaltung > Guthabenverwaltung > Guthabentransfers > Transaktionstyp: „Auszahlung“. Hier erfahren Sie, wie Sie eine Auszahlungsanweisung erstellen.
Wenn Sie eine Auszahlung beantragen, die die geltenden Auszahlungslimits überschreitet, wird diese als außerordentliche Auszahlung behandelt. Dies bedeutet, dass wir den Bankkontoinhaber und das IB-Konto abgleichen müssen. Falls das Zielbankkonto bereits für eine Einzahlung verwendet wurde, wird die Auszahlung bearbeitet. Andernfalls müssen Sie den Kundenservice kontaktieren und die erforderlichen Dokumente bereitstellen.
Problembehebung
Einzahlungen: Meine Bank hat das Guthaben übersendet, aber es wurde meinem IB-Konto noch nicht gutgeschrieben. Mögliche Gründe:
a) Ein Guthabentransfer dauert 1-4 Geschäftstage
b) Es fehlt eine Einzahlungsbenachrichtigung. Sie müssen diese in der Kontoverwaltung erstellen und ein Ticket an den Kundenservice schicken.
c) Korrekturdaten fehlen. Ihr Name oder Ihre IB-Kontonummer fehlt in den Transferdetails. Bitte kontaktieren Sie Ihre Bank und bitten Sie um die vollständigen Korrekturdaten.
d) Ein bei IB eingeleiteter ACH-Transfer ist auf 100,000 USD je Zeitraum von 7 Geschäftstagen beschränkt. Wenn Sie ein Portfolio-Margin-Konto eröffnet haben, bei dem eine Ersteinlage von 110,000 USD erforderlich ist, ist eine Einzahlung per Banküberweisung ggf. eine bessere Lösung, um die Wartezeit zu verringern, bis Sie beginnen können zu handeln. Wenn Sie ACH als Methode auswählen, können Sie entweder eine Wartezeit von knapp 2 Wochen in Kauf nehmen oder ein temporäres Downgrade auf ein Reg-T-Konto als mögliche Lösung erwägen.
Auszahlungen: Ich habe eine Auszahlung beantragt, aber das Guthaben wurde noch nicht meinem Bankkonto gutgeschrieben. Mögliche Gründe:
a) Ein Guthabentransfer dauert 1-4 Geschäftstage
b) Abgelehnt. Überschreitung des maximal möglichen Auszahlungsbetrags. Bitte prüfen Sie den Barsaldo Ihres Kontos. Beachten Sie, dass aus regulatorischen Gründen ab Einzahlung des Guthabens eine Haltefrist von 3 Tagen gilt, ehe das Guthaben ausgezahlt/abgehoben werden kann.
c) Ihre Bank hat das Guthaben zurückgesendet. Vermutlich stimmen die Namen des empfangenden Kontos und des sendenden Kontos nicht überein.
2. Konfigurieren Sie Ihr Konto für den Handel
Unterschied zwischen Cash- und Marginkonten: Falls Sie sich für unsere FastTrack-Kontoeröffnung entschieden haben, ist Ihr Konto automatisch ein Cash-Konto mit Handelsberechtigungen für US-Aktien. Wenn Sie Leverage nutzen und auf Marginbasis handeln möchten, erfahren Sie hier, wie Sie ein Upgrade Ihres Kontos auf ein Reg-T-Margin-Konto durchführen können.
Handelsberechtigungen
Um mit einem bestimmten Instrument in einem bestimmten Land handeln zu können, müssen Sie über die Kontoverwaltung die entsprechenden Handelsberechtigungen beantragen. Bitte beachten Sie, dass Handelsberechtigungen kostenlos sind. Möglicherweise werden Sie jedoch gebeten, Risikoinformationsdokumente zu unterzeichnen, die von örtlichen Aufsichtsbehörden benötigt werden. Hier erfahren Sie, wie Sie Handelsberechtigungen beantragen können.
Marktdaten
Wenn Sie für ein bestimmtes Produkt oder eine bestimmte Börse Echtzeit-Marktdaten beziehen möchten, müssen Sie ein Marktdatenpaket abonnieren und Abonnementgebühren an die entsprechende Börse entrichten. Hier erfahren Sie, wie Sie Marktdaten abonnieren können.
Der Marktdatenassistent hilft Ihnen bei der Auswahl des richtigen Datenpakets. Bitte sehen Sie sich dieses Video an, indem die Funktionsweise erläutert wird.
Kunden können für Ticker, zu denen sie kein Abonnement abgeschlossen haben, kostenlose verzögerte Marktdaten beziehen. Klicken Sie dazu auf die Schaltfläche „Kostenlose verzögerte Marktdaten“ in der entsprechenden Tickerzeile.
Beraterkonten
Werfen Sie einen Blick in unseren „Getting Started Guide“ für Berater. Hier erfahren Sie, wie Sie für Ihr Beraterkonto weitere Benutzer anlegen können, diesen Zugriffsrechte erteilen und vieles mehr.
3. So funktioniert der Handel
Wenn Sie den Umgang mit unserer Handelsplattformen erlernen möchten, ist die Trader-Akademie die beste Anlaufstelle für Sie. Dort finden Sie unsere Live-Webinare und Webinaraufzeichnungen in 10 Sprachen, sowie Touren und Dokumente zu unseren verschiedenen Handelsplattformen.
Trader Workstation (TWS)
Traders, die ausgefeilte Trading-Tools verwenden möchten, können unsere Market-Maker-entwickelte Trader Workstation (TWS) verwenden. Mit dieser Plattform können Sie dank einer benutzerfreundlichen tabellarischen Oberfläche Ihre Handelsgeschwindigkeit und Effizienz optimieren. Es werden über 60 Ordertypen und aufgabenspezifische Tools für sämtliche Trading-Stile angeboten und Kontosalden und Kontoaktivitäten können in Echtzeit geprüft und überwacht werden. Testen Sie die zwei verfügbaren Varianten:
TWS Mosaic: intuitiv und benutzerfreundlich, einfacher Handelszugang, Ordermanagement, Watchlisten und Charts, zusammengestellt in einer Ansicht, oder
Klassische TWS: Erweitertes Ordermanagement für Trader, die komplexere Tools und Algorithmen.
Allgemeine Beschreibung und Informationen / Kurzanleitung / Benutzerhandbuch
Interaktive Touren: TWS Grundlagen / TWS Konfiguration / TWS Mosaic
Platzierung einer Transaktion: Video zur klassischen TWS / Video zu Mosaic
Trading-Tools: Allgemeine Beschreibung und Informationen / Benutzerhandbuch
Anforderungen: Installation von Java für Windows / Installation von Java für MAC / Port 4000 und 4001 müssen offen sein
Login in die TWS / Download der TWS
WebTrader
Trader, die eine einfache und besonders übersichtliche Oberfläche bevorzugen, können unseren HTML-basierten WebTrader verwenden. Mit dieser Anwendung können Sie sich völlig unkompliziert Marktdaten anzeigen lassen, Orders übermitteln und Ihr Konto und Ihre Ausführungen kontrollieren. Nutzen Sie die aktuellste WebTrader-Version für Ihren jeweiligen Browser.
Kurzanleitung / WebTrader-Benutzerhandbuch
Einführung: Video zum WebTrader
Platzierung einer Transaktion: Video zum WebTrader
Login in den WebTrader
MobileTrader
Mit unseren Softwarelösungen für Mobilgeräte können Sie unterwegs Handel mit Ihrem IB-Konto betreiben. Die mobileTWS für iOS und die mobileTWS für BlackBerry sind speziell für diese Beliebten Modelle entwickelte Anwendungen, während die allgemeine MobileTrader-App auf den meisten anderen Smartphone-Typen unterstützt wird.
Allgemeine Beschreibung und Informationen
Ordertypen: Verfügbare Ordertypen und Beschreibungen / Videos / Tour / Benutzerhandbuch
Paper-Trading: Allgemeine Beschreibung und Informationen / So erhalten Sie ein simuliertes Paper-Trading-Konto
Sobald Ihr simuliertes Konto angelegt wurde, können Sie die Marktdaten aus Ihrem realen Konto mit dem Paper-Trading-Konto teilen: Kontoverwaltung > Konto verwalten > Einstellungen > Paper-Trading
4. Handel in aller Welt
IB-Konten sind Multiwährungskonten. In Ihrem Konto können Sie gleichzeitig mehrere verschiedene Währungen halten, was Ihnen den Handel mit verschiedenen Produkten in aller Welt in einem einzigen Konto ermöglicht.
Basiswährung
Ihre Basiswährung ist die Umrechnungswährung für Ihre Kontoauszüge und die Währung, die zur Berechnung Ihrer Margin-Anforderungen verwendet wird. Sie legen die Basiswährung für Ihr Konto im Rahmen des Kontoeröffnungsprozesses fest. Kunden können ihre Basiswährung jederzeit in der Kontoverwaltung ändern.
Wir wandeln Devisenpositionen automatisch in Ihre Basiswährung um.
Währungsumwandlungen müssen manuell vom Kunden vorgenommen werden. In diesem Video erfahren Sie, wie Sie eine Währungsumwandlung ausführen.
Wenn Sie eine Position in einer Währung eröffnen möchten, die Sie nicht in Ihrem Konto haben, haben Sie zwei Möglichkeiten:
A) Währungsumwandlung
B) IB-Margindarlehen (nicht für Cash-Konten verfügbar)
In diesem Kurs finden Sie eine Erläuterung der Funktionsweisen von Forex-Transaktionen
5. Fünf Punkte zur Optimierung Ihres Kundenerlebnisses
1. Kontraktsuche
Hier finden Sie unsere sämtlichen Produkte, Symbole und Spezifikationen.
2. IB Wissensdatenbank
Die Wissensdatenbank ist eine Sammlung aus Glossarbegriffen, Hilfe-Artikeln, Problemlösungstipps und Leitfäden, die Sie bei der Verwaltung Ihres IB-Kontos unterstützen können. Geben einfach in das Suchfeld ein, was Sie wissen möchten, und finden Sie Ihre Antwort.
3. Kontoverwaltung
Während unsere Trading-Plattformen Ihnen Zugang zu den Märkten gewähren, bietet die Kontoverwaltung Ihnen Zugang zu Ihrem IB-Konto. In der Kontoverwaltung können Sie Aufgaben rund um Ihr Konto ausführen, wie zum Beispiel Guthaben ein- und auszahlen, Kontoauszüge ansehen, Marktdaten- und Nachrichtenabonnements anpassen, Handelsberechtigungen ändern und Ihre persönlichen Informationen verifizieren oder ändern.
Login in die Kontoverwaltung / AM-Kurzanleitung / AM-Benutzerhandbuch
4. Das Secure-Login-System
Um Ihnen online das größtmögliche Maß an Sicherheit zu gewähren, hat Interactive Brokers das Secure-Login-System (SLS) eingeführt. Bei diesem System erfolgt der Zugriff auf Ihr Konto mittels einer Zwei-Faktoren-Authentifizierung - d. h. Ihre Identität wird bei der Anmeldung unter Verwendung von zwei Sicherheitsfaktoren überprüft: 1) ein Faktor, der auf Ihrem Wissen basiert (Eingabe Ihres Benutzernamens und Passworts), und 2) ein Faktor, der auf etwas in Ihrem physischen Besitz basiert (ein von IB bereitgestelltes Sicherheitsgerät, das zufällige, einmalig verwendbare Sicherheitscodes generiert). Da sowohl Kenntnis über Ihren Benutzernamen und Ihr Passwort als auch der physische Besitz des Sicherheitsgerätes für eine erfolgreiche Anmeldung im Konto erforderlich sind, wird die Gefahr eines Zugriffs auf Ihr Konto durch eine andere Person als Sie durch die Teilnahme am Secure-Login-System praktisch ausgeschlossen.
Aktivierung Ihres Sicherheitsgerätes / Erhalt einer Sicherheitscodekarte / Rücksendung Ihres Sicherheitsgerätes an IB
Sollten Sie Ihr Passwort vergessen oder Ihre Sicherheitscodekarte verloren haben, kontaktieren Sie uns bitte telefonisch für sofortigen Support.
5. Kontoauszüge und Berichte
Unsere Kontoauszüge und Berichte lassen sich ganz einfach erstellen und anpassen und decken alle Aspekte Ihres Kontos bei Interactive Brokers ab. Hier erfahren Sie, wie Sie Ihre Umsatzübersichten öffnen können.
IBKR Mobile Companion App for Apple Watch
Übersicht:
Interactive Brokers takes our intuitive and ergonomic mobile trading platform to the next level by providing you a companion app for the Apple Watch.
Background:
The companion app is designed to display information when a user has logged in to the IBKR Mobile app on their iPhone. It will work in both the Live Trading and Read Only Modes but does not support active trading. This companion app is only available for informational purpose only.
Table of contents
What does the app do?
At 'glance view' the app will display the following information; Amount of FYI Notification, Account Number, Daily P&L, Net Liquidation Value, Number of Open Orders, Number of Trades Executed, Excess Liquidity and number of Positions you currently own. It will also display the time when it has fetched the information from your iPhone.
Example:
.jpg)
Requirements
- Must have iPhone 5s or greater, using iOS 11 or later.
- Must have the IBKR Mobile app installed on your iPhone (version 11 or greater)
- Must have your Apple Watch paired to your iPhone (refer to: Set up your Apple Watch for directions)
- Must have watchOS 5 running on your Apple Watch.
Important: The Apple Watch applications are only 'companion' apps. This means they are not installed directly on the watch itself, but rather are a function of an application already installed on your iPhone.
How is the app installed?
1. Install the latest version of the IBKR Mobile app on your iPhone.
2. Pair your Apple Watch to your phone.
3. Launch the Watch app on your phone.
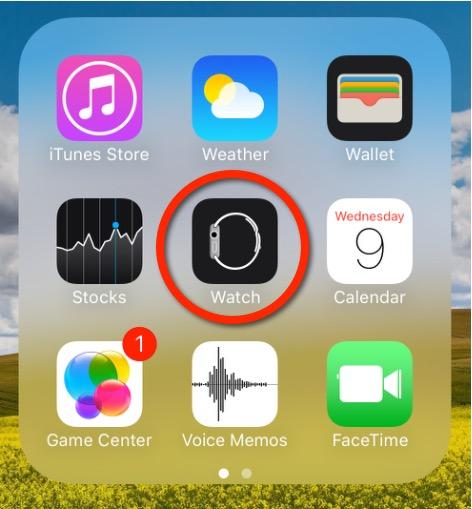
4. Scroll down on the main screen until you see your list of apps, locate the IBKR Mobile app and Tap on it.
.jpg)
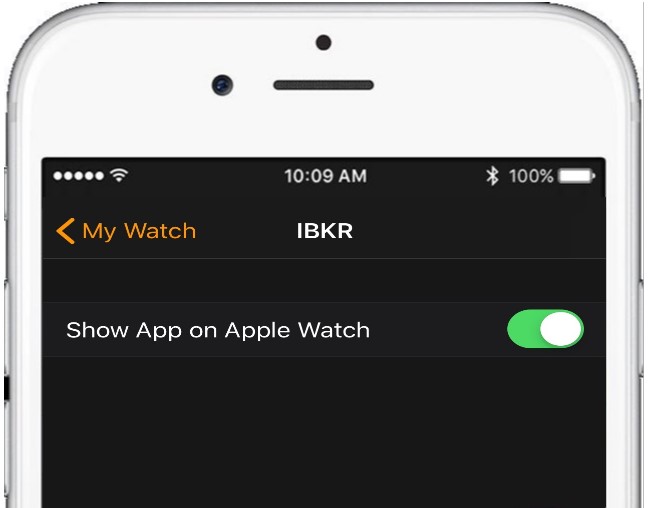
5. Enable Show App on Apple Watch by swiping the slider to the right (green).
6. After the top slider is set to green, you will see a text informing you that the app is being installed. At this stage the phone is sending the application to your watch per Bluetooth. This might take a short moment (approximately 30-60 seconds.) Once completed the companion app has been installed.
Note: Once enabled it will take 24 hours before P&L shows up on the watch after activation.
How do I confirm the app is installed?
On your Apple Watch click on the crown to access your Home Screen, you should now see an icon for the IBKR Mobile App.