Key Information Documents (KID)
Overview:
IBKR is required to provide EEA and UK retail customers with Key Information Documents (KID) for certain financial instruments.
Relevant products include ETFs, Futures, Options, Warrants, Structured Products, CFDs and other OTC products. Funds include both UCITS and non-UCITS funds available to retail investors.
Generally KIDs must be provided in an official language of the country in which a client is resident.
However, clients of IBKR have agreed to receive communications in English, and therefore if a KID is available in English all EEA and UK clients can trade the product regardless of their country of residence.
In cases where a KID is not available in English, IBKR additionally supports other languages as follows:
| Language | Can be traded by residents or citizens* of |
| German | Germany, Austria, Belgium, Luxembourg and Liechtenstein |
| French | France, Belgium and Luxembourg |
| Dutch | the Netherlands and Belgium |
| Italian | Italy |
| Spanish | Spain |
*regardless of country of residence
Reglamento EMIR: informe de obligaciones en el registro de operaciones y servicio delegado de Interactive Brokers para ayudarle a cumplir con sus obligaciones
1. Antecedentes. En 2009, el G20 se comprometió a realizar reformas destinadas a aumentar la transparencia y a reducir el riesgo de las contrapartes en el mercado de derivados extrabursátiles luego de la crisis financiera de 2008. El reglamento relativo a los derivados bursátiles, las entidades de contrapartida central y los registros de operaciones (el reglamento "EMIR”) implementa la mayoría de estas promesas en la UE. El reglamento EMIR es una normativa de la UE que entró en vigor el 16 de agosto de 2012.
2. Instrumentos financieros y clases de activos que pueden informarse conforme con el reglamento EMIR. Derivados negociados en mercados regulares y extrabursátiles para las siguientes clases de activos: crédito, intereses, acciones, commodities y derivados de divisas. La obligación de presentar informes no se aplica para warrants negociados en bolsa.
3. Para quiénes se aplican las obligaciones de presentación de informes EMIR. Las obligaciones de presentación de informes normalmente se aplican para todas las contrapartes establecidas en la UE, con excepción de las personas físicas. Se aplican para:
* Contrapartes financieras ("CF")
* Contrapartes no financieras por encima del umbral de compensación ("CNF+")
* Contrapartes no financieras por debajo del umbral de compensación ("CNF-")
* Entidades de terceros países fuera de la UE ("ETP") en algunas circunstancias limitadas.
Las obligaciones de presentación de informes se aplican básicamente para todas las entidades establecidas en la UE que hayan celebrado un contrato de derivados.
4. Contrapartes financieras ("CF"). Incluye a bancos, sociedades de inversión, entidades de crédito, aseguradoras, OICVM, planes jubilatorios, y fondos de inversión alternativos gestionados por un gestor (GFIA). Un fondo de inversiones alternativo ("FIA") solo se convertirá en una CF si el gestor de dicho FIA está autorizado conforme con la directiva sobre gestores de fondos de inversión alternativos ("DGFIA"), de modo que un fondo fuera de la UE podrá estar sujeto a los requisitos de la presentación de informes del reglamento EMIR.
5. Contraparte no financiera ("CNF"). Una CNF se define como una empresa establecida en la UE que no sea aquella definidas como CF o una contraparte central (“CPC”), como las cámaras de compensación. Las CNF tienen menos obligaciones que las CF. Pero cuando una CNF excede un "umbral de compensación", se convierte en una CNF+, cuando queda sujeta a casi las mismas obligaciones que las CF (incluyendo informe de valuación y garantía). A las CNF debajo del umbral de compensación se las conoce como CNF-. En la práctica, cualquier otra persona que no sea una persona física (es decir, una persona o personas que abren una cuenta conjunta)
se define como una CNF-, y está sujeta a las obligaciones de presentación de informes.
INTERACTIVE BROKERS HA DELEGADO EL SERVICIO DE PRESENTACIÓN DE INFORMES PARA AYUDARLE A CUMPLIR CON SUS OBLIGACIONES DE PRESENTACIÓN DE INFORMES
6. El servicio que ofrecerá Interactive Brokers a sus clientes para facilitarles el cumplimiento de sus obligaciones de presentación de informes, es decir, un servicio delegado para la presentación de informes de negociación que facilitará la emisión del identificador de entidad jurídica. Tal como se indica arriba, tanto las CF como las CNF deben informar los detalles de sus transacciones (en mercados regulares y extrabursátiles) ante registros de operaciones autorizados. Esta obligación puede descargarse directamente mediante un registro de operaciones, o delegando los aspectos operativos de la presentación de informes a la contraparte o a un tercero (que envíe los informes en su nombre).
Interactive Brokers tiene el objetivo de facilitarle la emisión de los identificadores de entidad jurídica, y le ofrece la delegación de informes para clientes para quienes ejecuta y compensa transacciones, sujeto al consentimiento del cliente, con el alcance de que sea posible así hacerlo desde una perspectiva operativa, jurídica y normativa.
Si usted está sujeto a la presentación de informes conforme con el reglamento EMIR, podrá brevemente iniciar sesión en el sistema de gestión de cuenta de IB y solicitar un identificador de entidad jurídica para delegar la presentación de informes a Interactive Brokers.
Tenemos la intención de incluir la presentación de informes de valoración, pero únicamente y con el alcance y durante el plazo permitido para que Interactive Brokers así lo haga desde una perspectiva jurídica y normativa, y cuando la contraparte deba así hacerlo (es decir, en los casos en que sea una CF o una CNF+).
De todos modos, esto estaría sujeto a la condición de que Interactive Brokers utilice su propia valoración de las transacciones para los fines de la presentación de informes.
7. ¿Puede delegarse la creación de informes EMIR? El reglamento EMIR le permite a cualquiera de las contrapartes delegar la creación de informes a un tercero. Si una contraparte o CPC delega la creación de informes a un tercero, seguirá siendo la última responsable del cumplimiento de las obligaciones de presentación de informes. Del mismo modo, la contraparte o el CPC deberán asegurar que el tercero a quien se haya delegado la obligación presente correctamente los informes. Los brókeres y díleres no tienen la obligación de presentar informes cuando actúen puramente en calidad de representante. Si una transacción en bloque da lugar a varias transacciones, cada transacción deberá informarse.
FONDOS Y SUBFONDOS. Las obligaciones conforme con el reglamento EMIR son para la contraparte que podrá ser el fondo o el subfondo. El fondo o el subfondo que es el mandante de las transacciones deberá proporcionar detalles sobre su clasificación (CF, CNF+ o CNF-), autorización para la presentación de informes delegados y la solicitud del identificador de entidad jurídica (el número "LEI").
8. Excepciones conforme con el artículo 1(4) y 1(5) del reglamento EMIR. Los artículos 1(4) y 1(5) del reglamento EMIR exceptúan a ciertas entidades de algunas o todas las obligaciones establecidas en el reglamento EMIR, dependiendo de su clasificación. Específicamente, las entidades exentas en virtud del artículo 1(4) están exentas de todas las obligaciones que se establecen en el reglamento EMIR, mientras que las entidades exentas de acuerdo con el artículo 1(5) están exentas de todas las obligaciones excepto la obligación de presentar informes, que continúa en vigor.
9. Entidades que cualifican conforme con el artículo 1(4) y 1(5) del reglamento EMIR. El artículo 1(4) inicialmente se aplicaba solamente para los bancos centrales de la UE, organismos públicos de la Unión involucrados en la gestión de deuda pública, y el Bank of International Settlements. Luego,
la aplicación de la exención del artículo 1(4) se amplió para incluir a los bancos centrales y los organismos de gestión de deuda de EE. UU. y Japón. La comisión ha indicado que podrán añadirse más bancos centrales extranjeros y organismos de gestión de deuda en caso de que consideren que la normativa equivalente en dichas jurisdicciones sea la adecuada. El artículo 1(5) exime ampliamente a las siguientes categorías de entidades:
la aplicación de la exención del artículo 1(4) se amplió para incluir a los bancos centrales y los organismos de gestión de deuda de EE. UU. y Japón. La comisión ha indicado que podrán añadirse más bancos centrales extranjeros y organismos de gestión de deuda en caso de que consideren que la normativa equivalente en dichas jurisdicciones sea la adecuada. El artículo 1(5) exime ampliamente a las siguientes categorías de entidades:
- Bancos de desarrollo multilaterales;
- Entidades del sector público no comerciales que sean propiedad de, y estén garantizadas por, un gobierno central; y
- El Mecanismo de estabilidad financiera europeo y el Mecanismo de estabilidad europeo.
10. Derivados negociados en mercados regulados y extrabursátiles.No existe una distinción entre los informes de contratos de derivados negociados en mercados regulados (“ETD”) y extrabursátiles dentro de las normativas de nivel 1, implementación de estándares técnicos, o los estándares técnicos normativos de la AEVM.
El contrato deberá identificarse utilizando un identificador de producto único. Además, será necesario un identificador de transacción única para las transacciones. En el caso de que un sistema global acordado de identificadores de producto no se implementare, se ha sugerido que los números internacionales de identificación de valores mobiliarios (“ISIN”), los Identificadores de instrumentos alternativos ("IIA"), o la clasificación de los códigos de instrumentos financieros ("CIF") pueden funcionar como alternativas.
11. Uso del registro de operaciones utilizado por Interactive Brokers. Interactive Brokers (U.K.) Limited utilizará los servicios de CME ETR, que es parte del CME Group.
12. Emisión de identificadores de entidades jurídicas ("LEI")
Todas las contrapartes de la UE que introduzcan transacciones de derivados deberán tener un número LEI para cumplir con las obligaciones de presentación de informes. El número LEI se utilizará con el fin de informar datos de la contraparte.
Un número LEI es un identificador único o código adjunto a una persona o estructura jurídica que permitirá la identificación inequívoca de las partes en transacciones financieras.
Reglamento EMIR. Información sobre la presentación de informes por obligaciones del registro de operaciones
13. Umbrales que determinan si una CNF es una CNF+ o CNF-. El incumplimiento de cualquiera de los siguientes valores de los umbrales de compensación significarán una clasificación como CNF+. Las posiciones se calcularán sobre una base media con renovación a 30 días.
• 1000 millones EUR en valor nocional bruto para contratos de derivados de crédito extrabursátiles;
• 1000 millones EUR en valor nocional bruto para contratos de derivados sobre acciones extrabursátiles;
• 3 mil millones EUR en valor nocional bruto para contratos derivados de tipos de interés extrabursátil;
• 3 mil millones EUR en valor nocional bruto para contratos de derivados sobre fórex extrabursátiles; y
• 3 mil millones EUR en valor nocional bruto para contratos de derivados sobre commodities extrabursátiles y otros contratos de derivados extrabursátiles no cubiertos arriba.
Con el fin de calcular si se ha alcanzado un umbral de compensación, una CNF deberá añadir las transacciones de las entidades no financieras en su grupo (y determinar o no si estas entidades se encuentran dentro o fuera de la UE) , pero las transacciones con descuentos se introducen con el fin de cobertura o tesorería. El término "transacciones de cobertura”, en este contexto, significa transacciones medibles objetivamente que reducen los riesgos directamente con relación a la actividad comercial o de financiación del tesoro de la CNF o de su grupo.
14. Informes de exposiciones. Las CF y CNF deberán informar respecto de lo siguiente:
* Las valoraciones a precios de mercado o valoraciones según modelos de cada contrato
* Detalles de todas las garantías depositadas, sobre la base de transacciones o carteras (es decir, cuando la garantía se calcula sobre la base de posiciones netas resultantes de un conjunto de contratos, en lugar de publicarse sobre la base de transacciones)
15. Horario para informar ante registros de operaciones. La fecha de inicio para la presentación de informes es el 12 de febrero de 2014:
* Nuevos contratos celebrados el 12 de febrero, o en fecha posterior, en una fecha de negociación +1;
* Las posiciones abiertas de contratos celebrados el 16 de agosto de 2012, o en fecha posterior, y que aún permanezcan abiertas al 12 de febrero de 2014, deben informarse en un registro operaciones para el 12 de febrero de 2014;
* Las posiciones abiertas de contratos celebrados antes del 16 de agosto, y que permanezcan abiertas el 12 de febrero de 2014, deberán informarse en un registro de operaciones al 12 de mayo de 2014;
* El informe de valoración y garantía deberá presentarse en un registro de operaciones al 12 de agosto de 2014;
* Los contratos que se hubieren celebrado el 16 de agosto de 2012, o en fecha anterior o posterior, pero que no estuvieren abiertos al 12 de febrero de 2014, deberán informarse en un registro de operaciones al 12 de febrero de 2017.
16. Lo que debe informarse y cuándo. La información debe presentarse ante las contrapartes de cada transacción (datos de las contrapartes), así como los contratos en sí mismos (datos comunes).
Hay 26 artículos que deben informarse respecto de los datos de una contraparte, y 59 artículos que deben informarse respecto de los datos comunes. Estos artículos se establecen dentro de las tablas 1 y 2 del Anexo de los detalles mínimos sobre los estándares técnicos normativos de la AEVM a ser informados en los registros de operaciones.
Las contrapartes y las CPC deben realizar un informe:
* cuando se celebra un contrato
* cuando se modifica un contrato
* cuando finaliza un contrato
Deberá realizarse un informe a más tardar el día hábil siguiente a la conclusión, modificación o finalización del contrato.
17. Lo que debe informarse y quién es responsable de informarlo. La presentación de informes se aplica para los derivados negociados en mercados regulares y extrabursátiles. La obligación de informar se aplica para contrapartes en una transacción, sin perjuicio de su clasificación. Deberá observar lo siguiente:
* El informe de la valoración y la garantía solo es necesario para CF y CNF+
* Normalmente, ambas contrapartes deberán informar cada transacción.
ESTA INFORMACIÓN ES CON FINES INFORMATIVOS PARA LOS CLIENTES COMPENSADOS POR INTERACTIVE BROKERS SOLAMENTE
NOTA: LA INFORMACIÓN ANTERIOR NO ESTÁ DESTINADA A SER UNA INTERPRETACIÓN INTEGRAL, EXHAUSTIVA NI DEFINITIVA DE LA NORMATIVA, SINO UN RESUMEN DE LA NORMATIVA RELATIVA AL REGLAMENTO EMIR Y DE LAS OBLIGACIONES DE PRESENTACIÓN DE INFORMES DE LOS REGISTROS DE OPERACIONES RESULTANTES.
Resumen de la implementación de las normas de la AEVM relativas a los CFD para clientes minoristas de IBIE e IBCE
Overview:
|
Los CFD son instrumentos complejos y están asociados a un riesgo elevado de perder dinero rápidamente debido al apalancamiento. El 63.7 % de las cuentas de inversores minoristas pierden dinero al negociar CFD con IBKR. Deberá considerar si entiende el funcionamiento de los CFD y si puede permitirse asumir el riesgo elevado de perder su dinero. |
La Asociación Europea de Valores y Mercados (AEVM) ha implementado nuevas normas aplicables a los clientes minoristas que operen en CFD, en vigor a partir del 1.º de agosto de 2018. Los clientes profesionales no se ven afectados.
Los reguladores nacionales han adoptado las normas de la AEVM de manera permanente.
Las normas consisten en: 1) límites de apalancamiento; 2) una norma de cierre de margen sobre una base por cuenta; 3) protección de saldo negativo sobre una base por cuenta; 4) una restricción de los incentivos ofrecidos para operar en CFD y 5) una advertencia de riesgo estandarizada.
La mayoría de los clientes (excepto las entidades reguladas) inicialmente se clasifican en la categoría de clientes minoristas. En ciertas circunstancias, IBKR podrá aceptar la reclasificación de cliente minorista a cliente profesional, o de cliente profesional a cliente minorista. Consulte la Clasificación del MiFID para obtener más información.
En las secciones siguientes se muestra la manera en la que IBKR ha implementado la decisión de la AEVM.
1 Límites de apalancamiento
1.1 Márgenes estipulados por la AEVM
La AEVM ha establecido límites de apalancamiento a diferentes niveles en función del subyacente:
- 3.33 % para los principales pares de divisas. Los principales pares de divisas son cualquier combinación de USD, CAD, EUR, GBP, CHF y JPY
- 5 % para pares de divisas no principales e índices principales.
- Los pares de divisas no principales son aquellos que incluyen una combinación con una divisa no especificada anteriormente, por ejemplo, USD.CNH
- Los índices principales son IBUS500, IBUS30, IBUST100, IBGB100, IBDE30, IBEU50, IBFR40, IBJP225 y IBAU200
- 10 % para índices no principales; IBES35; IBCH20; IBNL25; IBHK50
- 20 % para acciones individuales
1.2 Márgenes aplicados - Requisitos
Además de los márgenes de la AEVM, IBKR establece sus propios requisitos de margen (márgenes IB) en función de la volatilidad histórica del subyacente y otros factores. Se aplicarán los márgenes IB en caso de que sean superiores a los prescritos por la AEVM.
Puede encontrar más información sobre los márgenes IB y AEVM aplicables aquí.
1.2.1 Márgenes aplicados - Concentración mínima
Se aplicará un cargo por concentración en caso de que la cartera contenga un número pequeño de posiciones en CFD o acciones, o si las dos posiciones más grandes tuvieran una ponderación dominante. Se lleva a cabo una prueba de estrés, aplicando unos movimientos adversos del 30 % y del 5 % en las dos posiciones más grandes y en las posiciones restantes, respectivamente. Se utilizará la pérdida total como requisito de margen de mantenimiento en caso de que sea mayor que el requisito estándar para las posiciones en acciones y CFD combinadas. Tenga en cuenta que la comisión por concentración es el único caso en el cual el margen de las posiciones en CFD y acciones se calcula de conjunto.
1.3 Financiación de los requisitos de margen inicial
Solo puede utilizar efectivo para cubrir el margen inicial para abrir una posición en CFD.
Inicialmente, todo el efectivo utilizado para financiar la cuenta se encuentra disponible para la negociación de CFD. Todos los requisitos de margen inicial para otros instrumentos y efectivo utilizado para comprar acciones al contado reducen el efectivo disponible. Si su compra de acciones al contado ha creado un préstamo de margen, no habrá fondos disponibles para negociar CFD incluso si su cuenta tiene un capital significativo. De acuerdo con las normas de la AEVM, no podemos incrementar un préstamo de margen para financiar el margen para CFD.
Las ganancias de CFD realizadas se incluyen en efectivo, y están disponibles inmediatamente. No es necesario que el efectivo se liquide antes. No obstante, las ganancias no realizadas no pueden utilizarse para cumplir los requisitos de margen inicial.
2 Regla de cierre de posiciones abiertas basada en el margen
2.1 Cálculos y liquidaciones del margen de mantenimiento.
La AEVM exige que IBKR liquide las últimas posiciones en CFD cuando el capital de calificación disminuya por debajo del 50 % del margen inicial depositado para abrir las posiciones. IBKR podrá cerrar posiciones antes si nuestra visión del riesgo es más conservadora. El capital de calificación para este fin incluye CFD al contado y PyG de CFD no realizadas (positivo y negativo). Deberá observar que el CFD al contado excluye efectivo que admita los requisitos de margen para otros instrumentos.
La base para este cálculo es el margen inicial registrado en el momento de abrir una posición en CFD. Es decir, a diferencia de los cálculos de margen aplicables a otras posiciones no CFD, la cantidad del margen inicial no varía cuando el valor de la posición abierta cambia.
2.1.1 Ejemplo
Tiene 2000 EUR al contado en su cuenta y no tiene posiciones abiertas. Quiere comprar 100 CFD de XYZ a un precio límite de 100 EUR. Primero se le asignan 50 CFD y después los 50 restantes. Su capital disponible se reduce cuando sus operaciones se ejecutan:
|
|
Saldo |
Capital* |
Posición |
Precio |
Valor |
PyG no realizadas |
MI |
MM |
Efectivo disponible |
Violación MM |
|
Prenegociación |
2000 |
2000 |
|
|
|
|
|
|
2000 |
|
|
Posnegociación 1 |
2000 |
2000 |
50 |
100 |
5000 |
0 |
1000 |
500 |
1000 |
No |
|
Posnegociación 2 |
2000 |
2000 |
100 |
100 |
10000 |
0 |
2000 |
1000 |
0 |
No |
*La liquidez es igual al efectivo más las PyG no realizadas
El precio aumenta a 110. Su liquidez es ahora de 3000, pero no puede abrir posiciones adicionales porque su capital disponible es todavía 0 y, de conformidad con la normativa de la AEVM, IM y MM permanecen sin cambios:
|
|
Saldo |
Capital |
Posición |
Precio |
Valor |
PyG no realizadas |
MI |
MM |
Efectivo disponible |
ViolaciónMM |
|
Cambio |
2000 |
3000 |
100 |
110 |
11000 |
1000 |
2000 |
1000 |
0 |
No |
El precio baja a 95. Su liquidez baja a 1500, pero no hay violación de margen ya que está todavía por encima del requisito de 1000:
|
|
Saldo |
Capital |
Posición |
Precio |
Valor |
PyG no realizadas |
MI |
MM |
Efectivo disponible |
Violación MM |
|
Cambio |
2000 |
1500 |
100 |
95 |
9500 |
(500) |
2000 |
1000 |
0 |
No |
El precio cae una vez más a 85, lo que causa una violación de margen y la activación de la liquidación:
|
|
Saldo |
Capital |
Posición |
Precio |
Valor |
PyG no realizadas |
MI |
MM |
Efectivo disponible |
Violación MM |
|
Cambio |
2000 |
500 |
100 |
85 |
8500 |
(1500) |
2000 |
1000 |
0 |
Sí |
3 Protección de liquidez negativa
La decisión AEVM limita su responsabilidad relacionada con CFD a los fondos dedicados a la negociación en CFD. Otros instrumentos financieros (p. ej., acciones o futuros) no pueden liquidarse para satisfacer un déficit de margen de CFD.*
Por este motivo, los activos que no sean CFD no son parte de su capital en riesgo por la negociación de CFD.
En caso de perder más efectivo que el dedicado a la negociación de CFD, IB deberá liquidar la pérdida.
Como la protección de liquidez negativa representa riesgos adicionales para IBKR, cargaremos a los inversores minoristas un diferencial de financiación adicional del 1 % para posiciones en CFD mantenidas trasnoche. Podrá encontrar más información sobre los tipos de financiación de CFD aquí.
*Aunque no podemos liquidar posiciones no CFD para cubrir un déficit de CFD, podemos liquidar posiciones en CFD para cubrir un déficit no CFD.
Ventana de cuenta en TWS para clientes minoristas de IBKR Ireland e IBKR Central Europe
Overview:
Este artículo describe la información proporcionada en la ventana de cuenta en TWS para las entidades de IBKR con base en la UE.
|
Los CFD son instrumentos complejos y están asociados a un riesgo elevado de perder dinero rápidamente debido al apalancamiento. El 63.7 % de las cuentas de inversores minoristas pierden dinero al negociar CFD con IBKR. Deberá considerar si entiende el funcionamiento de los CFD y si puede permitirse asumir el riesgo elevado de perder su dinero. |
Background:
Los clientes minoristas residentes del EEE que mantienen una cuenta con uno de los brókeres europeos de IBKR, IBIE o IBCE, se encuentran sujetos a la normativa de la UE, las cuales introducen cobertura y otras restricciones aplicables para las transacciones con CFD.
En particular, la normativa requiere el uso de efectivo gratuito para cumplir con los requisitos de margen para los CFD, y les prohíben a los clientes minoristas el uso de valores en la cuenta como garantía para tomar prestado fondos para iniciar o mantener una posición en CFD. Por favor, consulte el resumen de la implementación de normas relativas a los CFD de la AEVM para clientes minoristas de IBIE e IBCE para más detalles.
Las cuentas de las entidades de IBKR en la UE son cuentas universales en las cuales los clientes pueden negociar todas las clases de activos disponibles en la plataforma de IBKR, pero, a diferencia de las entidades de IBKR en EE. UU. y el Reino Unido, no existen segmentos financiados individualmente.
A continuación, se describen ejemplos prácticos de cómo se aplica esta restricción junto con detalles acerca de cómo los clientes pueden controlar el efectivo gratuito disponible para las transacciones con CFD.
Ventana de cuenta
IBKR hace valer la restricción relacionada con el efectivo disponible calculando los fondos disponibles para la negociación de CFD sobre una base de tiempo real, rechazando nuevas órdenes y liquidando posiciones existentes cuando el efectivo disponible no fuere suficiente para cubrir los requisitos de margen inicial y de mantenimiento para CFD.
IBKR les ofrece a sus clientes la posibilidad de controlar el efectivo disponible para transacciones con CFD mediante la mejora en la ventana de cuenta en TWS, la cual muestra el nivel de efectivo disponible en la cuenta. Más importante aún, los fondos que se muestran como disponibles para la negociación con CFD no implican que el efectivo se mantiene en un segmento por separado. Simplemente indica la parte del saldo total de la cuenta disponible para la negociación de CFD.
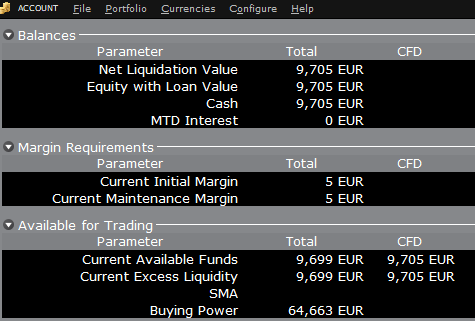
Por ejemplo, asuma que una cuenta tiene 9705 EUR en efectivo y no tiene posiciones. Todo el efectivo se encuentra disponible para abrir posiciones en CFD, o posiciones en cualquier otra clase de activo:
Si la cuenta ahora compra 10 acciones de AAPL por un valor total de 1383 USD, el efectivo en la cuenta
se reduce en la cantidad correspondiente en EUR, y los fondos disponibles para la negociación de CFD se reduce
en la misma cantidad:
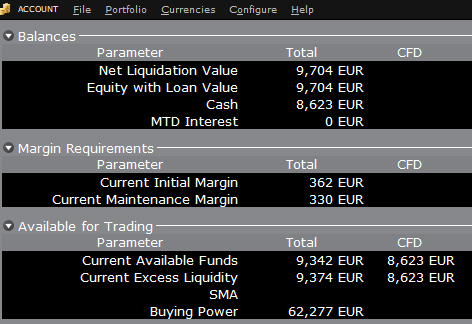
Tenga en cuenta que el total de fondos disponible se reduce en una cantidad más pequeña, correspondiente al requisito de margen para acciones.
Si, en lugar de comprar acciones de AAPL, la cuenta compra 10 CFD de AAPL, el impacto será distinto debido a que la transacción comprende un contrato de derivados en lugar de la compra del activo subyacente en sí. No hay una reducción del efectivo, pero los fondos disponibles para los CFD se reducirán en el requisito de margen del CFD para garantizar el cumplimiento del contrato:
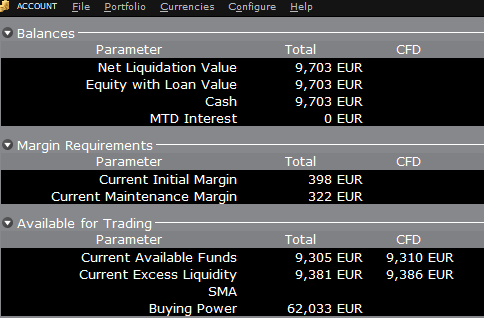
En este caso, el total de fondos disponibles y fondos disponibles para CFD se reducen por una cantidad igual: el requisito de margen del CFD.
Financiación
Según se observó anteriormente, las cuentas con base en la UE no tienen segmentos y, por tanto, no hay necesidad de realizar transferencias internas. Los fondos se encuentran disponibles para negociaciones en todas las clases de activos que se indican en la ventana de la cuenta, sin la necesidad de realizar barridos ni transferencias.
Tenga en cuenta también que, en caso de que una cuenta tenga un préstamo de margen, es decir, efectivo negativo, no será posible abrir posiciones en CFD debido a que el requisito de margen debe cumplirse mediante efectivo positivo y disponible. En caso de tener un préstamo de margen y desear negociar CFD, deberá primero cerrar las posiciones de margen para eliminar el préstamo o añadir el efectivo a la cuenta en una cantidad que cubra el préstamo de margen y cree un colchón de efectivo suficiente para el margen necesario para el CFD.
TWS Account Window for Retail Clients of IBKR Ireland and Central Europe
Overview:
This article describes the information provided in the TWS account window for IBKRs EU based entities.
|
CFDs are complex instruments and come with a high risk of losing money rapidly due to leverage. 61% of retail investor accounts lose money when trading CFDs with IBKR. You should consider whether you understand how CFDs work and whether you can afford to take the high risk of losing your money. |
Background:
Retail clients who are residents of the EEA and therefore maintain an account with one of IBKR’s European brokers, IBIE or IBCE, are subject to EU regulations which introduce leverage and other restrictions applicable to CFD transactions.
Notably the regulations require the use of free cash to satisfy CFD margin requirements and prohibit retail clients from using securities in the account as collateral to borrow funds to initiate or maintain a CFD position. Please see Overview of ESMA CFD Rules Implementation for Retail Clients at IBIE and IBCE for full details.
The accounts of IBKRs EU entities are universal accounts in which clients can trade all asset classes available on IBKRs platform, but unlike IBKRs US and UK entities, there are no separately funded segments.
Working examples of how this restriction is applied, along with details as to how clients can monitor free cash available for CFD transactions, are outlined below.
Account Window
IBKR enforces the restriction relating to free cash by calculating the funds available for CFD trading on a real-time basis, rejecting new orders and liquidating existing positions when the available free cash is insufficient to cover CFD initial and maintenance margin requirements.
IBKR offers clients the ability to monitor free cash available for CFD transactions via an enhancement to the TWS Account Window which displays the level of free cash in the account. Importantly, the funds shown as available for CFD trading do not imply that cash is held in a separate segment. It simply indicates what proportion of total account balances is available for CFD trading.
For example, assume that an account has EUR 9,705 in cash and no positions. All the cash is available to open CFD positions, or positions in any other asset class:
If the account now purchases 10 shares of AAPL stock for an aggregate value of USD 1,383 the cash in the account is reduced by a corresponding amount in EUR, and the funds available for CFD trading are reduced by the
same amount:
Note that Total available funds are reduced by a smaller amount, corresponding to the stock margin requirement.
If, instead of buying AAPL stock, the account buys 10 AAPL CFDs the impact will be different. As the transaction involves a derivative contract rather than the purchase of the underlying asset itself, there’s no reduction in cash but the funds available for CFDs are reduced by the CFD margin requirement to secure performance on the contract:
In this case Total available funds and CFD available funds are reduced by an equal amount; the CFD margin requirement.
Funding
As noted above, EU-based accounts do not have segments and therefore there is no need for internal transfers. Funds are available for trades in all asset classes in the amounts indicated in the account window, without the need for sweeps or transfers.
Note also that should an account have a margin loan, i.e. negative cash, it will not be possible to open CFD positions since the CFD margin requirement must be satisfied by free, positive cash. Should you have a margin loan and wish to trade CFDs you must first either close margin positions to eliminate the loan, or add cash to the account in an amount that covers the margin loan and creates a cash buffer sufficient for the necessary CFD margin.
IBKR Metals CFDs – Facts and Q&A
Overview:
The following article is intended to provide a general introduction to London Gold and Silver Contracts for Differences (CFDs) issued by IBKR.
Please follow these links for information on IBKR Share CFDs, Index CFDs and Forex CFDs.
Risk Warning
CFDs are complex instruments and come with a high risk of losing money rapidly due to leverage.
61% of retail investor accounts lose money when trading CFDs with IBKR.
You should consider whether you understand how CFDs work and whether you can afford to take the
high risk of losing your money.
ESMA Rules for CFDs (Retail Clients only)
The European Securities and Markets Authority (ESMA) has enacted new CFD rules effective 1st August
2018.
The rules include: 1) leverage limits on the opening of a CFD position; 2) a margin close out rule on a per
account basis; and 3) negative balance protection on a per account basis.
The ESMA Decision is only applicable to retail clients. Professional clients are unaffected.
Please refer to the following articles for more detail:
ESMA CFD Rules Implementation at IBKR (UK) and IBKR LLC
ESMA CFD Rules Implementation at IBIE and IBCE
Introduction
A London Gold CFD enables you to have exposure to price movements of physical Gold without actually owning it. A London Gold CFD is an agreement between you and IBKR to exchange the difference in price of the underlying over a period of time. The difference to be exchanged is determined by the change in the reference price of the underlying. Thus, if the price of physical Gold traded on the London bullion market rises and you are long the CFD, you receive cash from IBKR and vice versa. A London Gold CFD can be bought long or sold short to suit your view of market direction in the future.
Contract Specifications
| Contract | IBKR Symbol | Per Trade Fee | Minimum per Order | Multiplier |
| London Gold | XAUUSD | 0.015% | USD 2.00 | 1 |
| London Silver | XAGUSD | 0.03% | USD 2.00 | 1 |
Price Determination
The IBKR London Gold and Silver CFDs reference physical Gold and Silver traded on the London bullion market. The London bullion market is a wholesale over-the-counter market for the trading of precious metals. Trading is conducted among members of the London Bullion Market Association (LBMA). Most of the members are major international banks.
IBKR receives quote streams from approximately 10 such major banks, in much the same way it does for cash forex. IBKR Smart routes between the banks, and the best available price at any given time becomes the reference price for the CFDs. IBKR does not add a spread to the banks’ quotes.
Low Commissions and Financing Rates: Unlike other CFD providers IBKR charges a transparent
commission, rather than widening the spread. Commission rates are only 0.015% for London Gold and 0.03% for London Silver. Overnight financing rates are just benchmark +/- 1.5% (an additional 1% surcharge is added for retail accounts).
Transparent Quotes: Because IBKR does not widen the spread, the Metals CFD quotes accurately
represent the spreads and price movements of the related cash metal, as described above.
Margin Efficiency: IBKR establishes house-margin requirements based on historic volatility of the
underlying and other factors. Retail clients are subject to regulatory minimum initial margins of 5% for
London Gold or 10% for London Silver.
Trading Permissions: Same as for Share and Index CFDs.
Market Data Permissions: Metals CFD market data is free, but a permission is required for system
reasons.
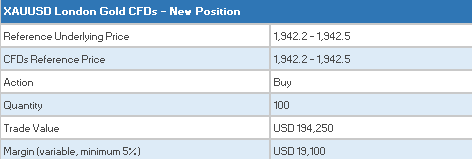
Worked Trade Example (Professional Clients):
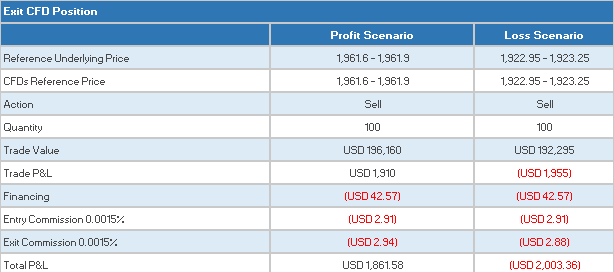
You purchase 100 XAUUSD CFDs at $1,942.5 for USD 194,250 which you then hold for 5 days.
![]()
Closing the Position
CFD Resources
Below are some useful links with more detailed information on IB’s CFD offering:
Frequently asked Questions
Are short Metals CFDs subject to forced buy-in?
No.
Can I take delivery of the underlying metal?
No, IBKR does not support physical delivery for Metals CFDs.
Are there any market data requirements?
The market data for Metal CFDs is free, and is included the market data for Index CFDs. However, you need to subscribe to the permission for system reasons. To do this, log into Account Management, and click through the following tabs: Settings/User Settings/Trading Platform/Market Data Subscriptions. Alternatively you can set up an Index or Metals CFD in your TWS quote monitor and click the “Market Data Subscription Manager” button that appears on the quote line.
How are my CFD trades and positions reflected in my statements?
If you are a client of IBKR (U.K.) or IBKR LLC, your CFD positions are held in a separate account segment identified by your primary account number with the suffix “F”. You can choose to view Activity Statements for the F-segment either separately or consolidated with your main account. You can make the choice in the statement window in Account Management.
If you are a client of other IBKR entities, there is no separate segment. You can view your positions normally alongside your non-CFD positions.
In what type of IB accounts can I trade CFDs e.g., Individual, Friends and Family,
Institutional, etc.?
All margin and cash accounts are eligible for CFD trading.
Can I trade CFDs over the phone?
No. In exceptional cases we may agree to process closing orders over the phone, but never opening
orders.
Can anyone trade IB CFDs?
All clients can trade IB CFDs, except residents of the USA, Canada, Hong Kong, New Zealand and
Israel. There are no exemptions based on investor type to the residency-based exclusions.
Bonus Certificates Tutorial
Introduction
Bonus certificates are designed to provide a predictable return in sideways markets, and market returns in rising markets.
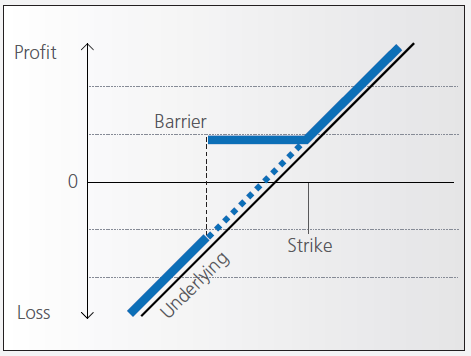
At the time they’re issued, bonus certificates normally have a term to maturity of two to four years. You will receive a specified cash pay-out (“bonus level” or “Strike”) if at maturity the price of the underlying is below or at the strike, as long as the underlying instrument has not touched or fallen below an established price level (“safety threshold” or “barrier”) during the term of the certificate.
Unless the certificate has a cap, you continue to participate in the price gains if the underlying instrument rises above the bonus level. In this case you either receive the corresponding number of shares or a cash settlement reflecting the value of the underlying instrument on the maturity date.
However, if the barrier is breached, you will no longer be entitled to the bonus payment. The value of the certificate then corresponds to the value of the underlying (times the ratio). In other words, once the barrier has been touched the certificate effectively converts to an index certificate. You will receive either the corresponding number of shares or a cash settlement reflecting the value of the underlying instrument on the maturity date.
Although there is no structured leverage, the presence of the barrier creates effective leverage. When the price of the underlying instrument approaches the barrier the probability of a breach increases, affecting the price of the certificate disproportionately.
Pay-out Profile
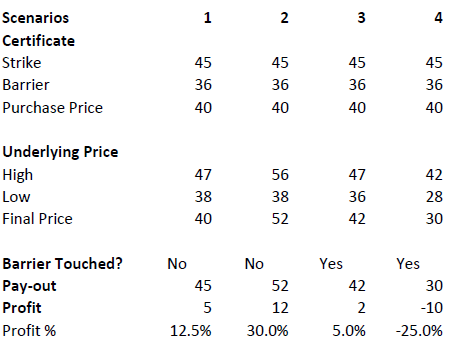
Example
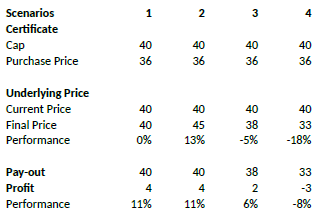
Assume a bonus certificate on ABC share. The certificate has a strike of EUR 45.00 and a barrier set at EUR 36.00. The table below shows scenarios depending on the trading range of the underlying, the final price of the underlying and whether the barrier has been touched or not.
Warrant Tutorial
Introduction
A warrant confers the right to buy (call-warrant) or sell (put-warrant) a specific quantity of a specific underlying instrument at a specific price over a specific period of time.
Pay-out Profile
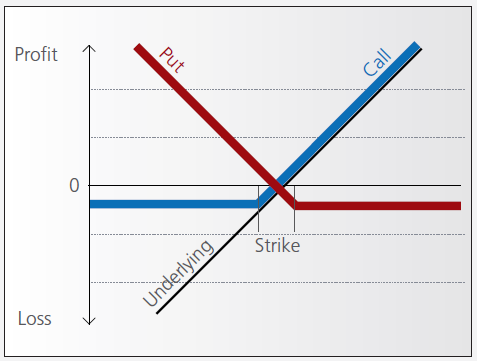
With some warrants, the option right can only be exercised on the expiration date. These are referred to as “European-style” warrants. With “American-style” warrants, the option right can be exercised at any time prior to expiration. The vast majority of listed warrants are cash-exercised, meaning that you cannot exercise the warrant to obtain the underlying physical share. The exception to this rule is Switzerland, where physically settled warrants are widely available.
IBKR does allow for US and Canadian warrant exercise. Customers wishing to do so should submit a Customer Service ticket stating the name/symbol of the warrant, the quantity of shares and the intended action (i.e. exercise). The broker will pass through all associated exercise costs to the customer upon completion of the request. US or Canadian warrants are not eligible for auto-exercise at expiration. Warrants remaining in an account at expiration will be removed as worthless.
Factors that influence pricing
Not only do changes in the price of the underlying instrument influence the value of a warrant, a number of other factors are also involved. Of particular importance to investors in this regard are changes in volatility, i.e. the degree to which the price of the underlying instrument fluctuates. In addition, changes in interest rates and the anticipated dividend payments on the underlying instrument also play a role.
However, changes in implied volatility - as well as interest rates and dividends - only affect the time value of a warrant. The primary driver - intrinsic value - is solely determined by the difference between the price of the underlying instrument and the specified exercise price.
Historical and implied volatility
In addressing this topic, a differentiation has to be made between historical and implied volatility. Implied volatility reflects the volatility market participants expect to see in the financial instrument in the days and months ahead. If implied volatility for the underlying instrument increases, so does the price of the warrant.
This is because the probability of profiting from a warrant during a particular time-frame increases if the price of the underlying instrument is highly volatile. The warrant is therefore more valuable.
Conversely, if implied volatility decreases, that leads to a decline in the value of warrants and hence occasionally to nasty surprises for warrant investors who aren’t familiar with the concept and influence of volatility.
Interest rates and dividends
Issuers hedge themselves against price changes in the warrant through purchases and sales of the underlying instrument. Due to the leverage afforded by warrants, the issuer needs considerably more capital to hedge its exposure than you require to buy the warrants. The issuer’s interest expense associated with that capital is included in the price of the warrant. The amount of embedded interest reduces over time and at expiration is zero.
In the case of puts, the situation is exactly the opposite. Here, the issuer sells the underlying instrument
short to establish the necessary hedge, and in so doing receives capital that can earn interest. Thus interest reduces the price of the warrant by an amount that decreases over time.
As the issuer owns shares as a part of its hedging operations, it is entitled to receive the related dividend
payments. That additional income reduces the price of call warrants and increases the price for puts. But if the dividend expectations change, that will have an influence on the price of the warrants. Unanticipated special dividends on the underlying instrument can lead to a price decline in the related warrants.
Key valuation factors
Let’s assume the following warrant:
Warrant Type: Call
Term to expiration: 2 years
Underlying : ABC Share
Share price: EUR 30.00
Strike: EUR 30.00
Exercise ratio: 0.1
Warrant’s price: EUR 0.30
Intrinsic value
Intrinsic value represents the amount you could receive if you exercised the warrant immediately and then bought (in the case of a call) or sold (put) the underlying instrument in the open market.
It’s very easy to calculate the intrinsic value of a warrant. In our example the intrinsic value is EUR 00.00
and is calculated as follows:
(price of underlying instrument – strike price) x exercise ratio
= (EUR 30.00 – EUR 30.00) x 0.1
= EUR 00.00
If the price of the ABC share increases by EUR 1, the intrinsic value becomes
= (EUR 31.00 – EUR 30.00) x 0.1
= EUR 00.10
The intrinsic value of a put warrant is calculated with this formula:
(strike price – price of underlying instrument) x exercise ratio
It’s important to note that the intrinsic value of a warrant can never be negative. By way of explanation:
if the price of the underlying instrument is at or below the exercise price, the intrinsic value of a call equals zero. In this instance, the price of the warrant consists only of “time value”. On the flipside, the intrinsic value of a put is equal to zero if the price of the underlying instrument is at or above the exercise price.
Time value
Once you’ve calculated the intrinsic value of a warrant, it’s also easy to figure out what the time value of that warrant is. You simply deduct the intrinsic value from the current market price of the warrant. In our example, the time value is equal to EUR 1.30 as you can see from the following calculation:
(warrant price – intrinsic value)
= (EUR 0.30 EUR – EUR 0.00)
= EUR 0.30
Time value gradually erodes during the term of a warrant and ultimately ends up at zero upon expiration. At that point, warrants with no intrinsic value expire worthless. Otherwise you can expect to receive payment of the intrinsic value. Take note, though: a warrant’s loss of time value accelerates during the final months of its term.
Premium
The premium indicates how much more expensive a purchase/sale of the underlying instrument would be via the purchase of a warrant and the immediate exercise of the option right as opposed to simply buying/selling the underlying instrument in the open market.
Hence the premium is a measure of how expensive a warrant actually is. It follows that, when given a choice between warrants with similar features, you should always buy the one with the lowest premium. By calculating the premium as an annualized percentage, warrants with different terms to expiry can be compared with each other.
The percentage premium for the call warrant in our example can be calculated as follows:
(strike price + warrant price / exercise ratio – share price) / share price * 100
= (EUR 30.00 + EUR 0.30 / 0.1 – EUR 30.00) / EUR 30.00 x 100
= 10 percent
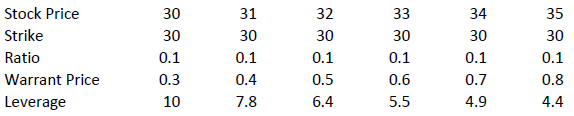
Leverage
The amount of leverage is the price of the share * ratio divided by the price of the warrant. In our example 30.00*0.1/0.3 = 10. So when the price of ABC increases by 1% the value of the warrant increases by 10%.
The amount of leverage is not constant however; it varies as intrinsic and time value changes, and is particularly sensitive to changes in intrinsic value. As a rule of thumb, the higher the intrinsic value of the warrant, the lower the leverage. For example (assuming constant time value):
Knock-out (Turbo) Tutorial
Introduction
Knock-out warrants (turbos), like vanilla warrants, derive their value from the difference between the price of the underlying and the strike. They differ significantly however from vanilla warrants in many important respects:
- They can expire (knock-out) prematurely if the price of the underlying instrument touches or falls below (in the case of knock-out calls) or exceeds (in the case of knockout puts) a predetermined barrier-level. It expires worthless if the barrier equals the strike, or it may have a residual stop-loss value if the barrier is set higher than the strike (in the case of a call).
- Changes in implied volatility have little or no impact on knock-out products, therefore their pricing is easier for investors to comprehend than that of warrants.
- They have little or no time value (because of the presence of the knock-out barrier), and therefore have a higher degree of leverage than a warrant with the same strike. This is because the absence of time value makes the instrument “cheaper”.
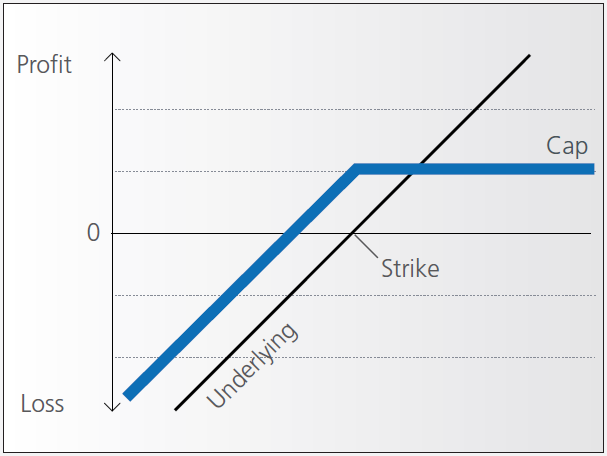
Pay-out Profile
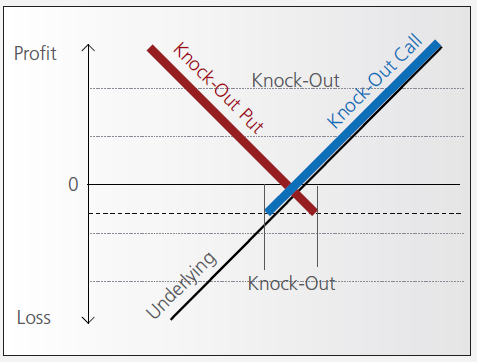
Leverage
As discussed above, knock-out warrants exhibit high degrees of leverage, particularly as the price of the underlying nears the strike/barrier. Consider the following example of a long turbo on the Dow Jones Index, compared to a vanilla warrant:
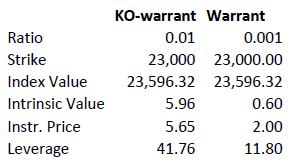
Intrinsic value = (index value – strike) x ratio
Leverage = Index Value x Ratio / Instrument Price
A vanilla warrant retains significant time value even as the underlying price approaches the strike, sharply reducing its leverage compared to a knock-out warrant.
Product types
As discussed above, the barrier may either equal the strike, or be set above (calls) or below (puts). In the latter cases a small residual value remains after knock-out, corresponding to the difference between the barrier (the stop-loss level) and the strike.
Moreover, knock-out products may either have an expiration date or may be open-ended. This makes a difference in the way interest is accounted for. If the contract has an expiration date interest is included in the premium, the amount of which reduces over time and is zero on expiration. This is analogous to a standard vanilla warrant.
in relation to an expiration date. The price of the contract therefore corresponds exactly to its intrinsic value. Interest however must be accounted for. This is done by a daily adjustment of the barrier and strike. The following example shows the daily adjustment for a long open-end turbo on the Dow Jones Index:
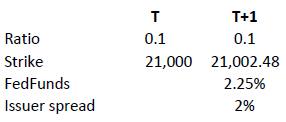
The adjustment = Strike T x (1+ FedFunds/360 + Issuer Spread/360).
The intrinsic value of the instrument is correspondingly reduced as follows, assuming no change in the value of the DJ Index):
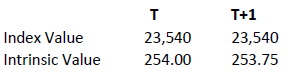
Intrinsic value = (index value – strike) x ratio
Discount Certificates Tutorial
Introduction
Discount certificates are designed to provide an enhanced return in sideways markets, compared to a direct investment in the underlying.
Discount certificates make it possible for you to buy an underlying instrument for less than its current market price. However, the maximum payback on a discount certificate is limited to a predetermined amount (cap).
Discount certificates normally have a term to maturity of one to three years. At maturity, a determination is made of where the price of the underlying instrument stands.
If it is at or above the cap, you’ll earn the maximum return and receive payment of the amount reflected by the cap.
If the price of the underlying instrument is below the cap on the maturity date, you’ll receive either the corresponding number of shares or a cash settlement reflecting the value of the underlying instrument on the maturity date.
Pay-out Profile
Example
Assume a discount certificate on ABC share. The certificate has a cap of EUR 40.00, and a purchase price of EUR 36.00. The table below shows scenarios depending on the final price of the underlying.